Literature search results and study characteristics
A total of 2270 articles were initially retrieved from the various databases. After the duplicate articles were removed and the titles and abstracts were screened, 2235 more articles were excluded. The full texts of the remaining 35 articles were reviewed according to the inclusion criteria. Eventually, only 11 articles were included. Twenty-six articles were excluded for the following reasons: 6 studies did not assess the outcome of CEC; 3 were reviews; 10 were abstracts of articles for which the full texts were not available; and 6 were animal studies. For the rest of the studies listed, there were a total of 6 observational studies and 5 intervention studies. The whole screening process is shown in the flow chart in Fig 1.
Table 1 and Table 2 show the main characteristics of the included studies. These 11 articles were published from 2012 to 2019. Of these studies, 7 were conducted in the USA, 3 were conducted in the UK, and 1 was conducted in Spain. The sample size of these studies ranged from 36 to 401; several of them had a sample size ranging from 50 to 100, which was considered a modest size, and 3 other studies had a large sample size (> 100). The average age of the participants ranged from 42 to 65 years. Cases and controls were matched by gender, age and body mass index (BMI) in the case-control studies. According to the NOS and D&B standard criteria, the quality scores of the 6 observational studies ranged from 5 to 8, which indicated moderate to high quality. Moreover, the quality scores of the intervention studies ranged from 11 to 17, and 2 studies were considered high-quality and 3 were considered low-quality studies. Most observational studies did not report the nonresponse rate, and the D&B scores indicated that the intervention studies had weak external validity.
The main outcome: changes in the CEC and HDL-C levels among RA patients
A total of 5 observational studies reported the CEC in both the case and control groups, with a total of 809 participants. The pooled results showed that the CEC of the RA patients was not significantly lower than that of the healthy controls (SMD: -0.34, 95% CI: -0.83 to 0.14; I2 = 89%, P for heterogeneity < 0.001). In addition, 6 studies including 845 subjects in which the plasma HDL-C levels were measured showed that patients with RA had lower HDL-C levels (WMD: -3.91, 95% CI: -7.15 to -0.68, I² = 64%, P for heterogeneity = 0.020) (Fig 2). In addition, the TC and LDL-C plasma levels but not the TG level significantly differed between the two groups (see Additional file 1).
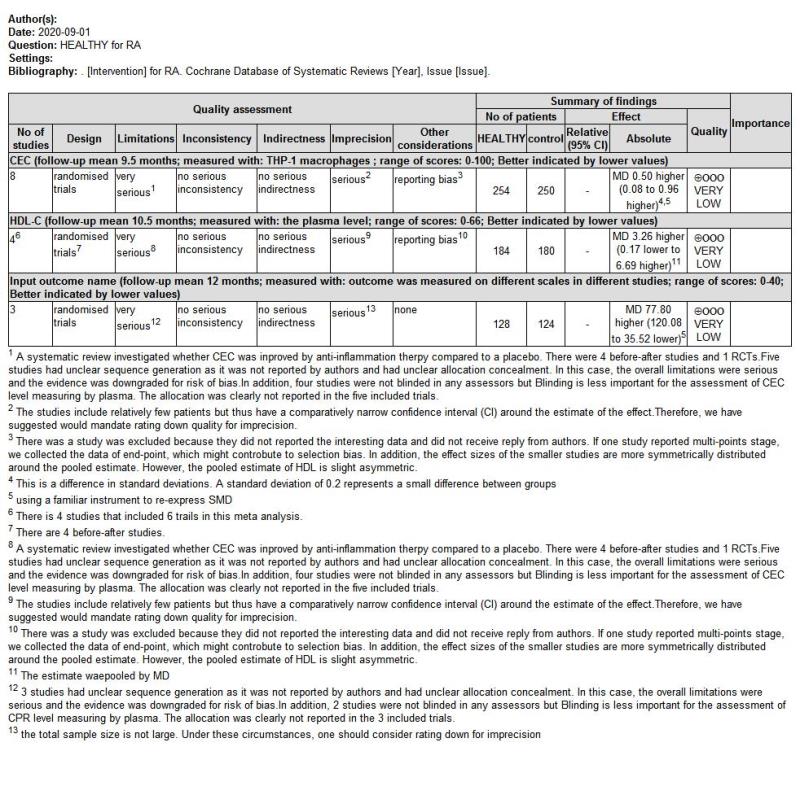
A total of 5 before-after studies that included 8 trials revealed a statistically significant elevation of CEC in RA patients who had taken anti-rheumatic medications compared to the baseline (SMD: 0.20, 95% CI: 0.02 to 0.37; I2 = 0%, P for heterogeneity = 0.680). In addition, only 4 intervention studies were suitable for inclusion in the analysis of the change in HDL-C levels. The plasma HDL-C levels was increased in the RA patients after anti-rheumatic drug treatment than at baseline (WMD: 3.63, 95% CI: -0.13 to 7.39). The heterogeneity was quite high (I2 = 0%, P for heterogeneity = 0.640) (Fig 3). Other lipid parameters, such as LDL-C, TC and TG levels, were not significantly different between the baseline and follow-up (see Additional file 2).
The secondary outcome: the levels of CRP and ESR in RA
In the observational studies, five studies reported the CRP level as a continuous variable. The pooled analysis data showed that the CRP level was higher in the RA patients than in the healthy controls (SMD: 2.74, 95% CI: 1.13 to 4.36; I2= 98%, P for heterogeneity < 0.001). (Fig 2). However, the CRP level significantly decreased after anti-rheumatic drug therapy in the intervention studies (SMD: -1.61, 95% CI: -1.89 to -1.32; I2 = 2%, P for heterogeneity = 0.360). A high level of ESR has been found in patients with RA (SMD: 1.22, 95% CI: 0.66 to 1.78; I2= 83%, P for heterogeneity = 0.003). The pooled SMD from 5 trials revealed the level of ESR was decrease in RA patient who received anti-inflammation therapy (SMD: -1.98, 95%CI: -3.23 to -.0.74; I2 = 92%, P for heterogeneity < 0.001) (Fig 3).
Subgroups and sensitivity analysis
Substantial heterogeneity were observed in our meta analysis for CEC, HDL-C,CRP and ESR. Evaluation of subgroup by DAS28 provided similar results as the previous overall estimate. A heterogeneity reduction of HDL-C was significant when subgroup analysis stratified by age (< 55 years/ ≥ 55 years) was conducted (I2 = 35.0%; I2 = 19.6%, respectively). Part of the heterogeneity might be explained by the variables (see Additional file 3). The sensitivity analysis showed that the overall effect sizes of CEC, CRP and ESR obtained using the fixed-effects and random-effects models were identical, and no individual study significantly affected the pooled results. When we excluded two studies [25,26]. However, the result of HDL-C was different from the previous conclusion. (see Additional file 4 and 5). Two studies has substantial impact on the robustness of overall estimate through excluding one study at a time.
Publication bias
Funnel plots for CEC, HDL and CRP were created to assess publication bias (Fig 4). The presence of publication bias was also evaluated by using Begg’s and Egger’s tests. Currently, the results of Egger’s test (PCEC = 0.201; PHDL-C = 0.699; PCRP = 0.932; PESR = 0.475) and Begg’s test (PCEC = 0.221; PHDL-C = 0.452; PCRP = 0.806; PESR = 1.000). However, the statistical power for detecting publication bias was low due to the small number of studies.
The assessment of cumulative evidence
The GRADE rating for the quality of evidence on each outcome parameter was showed in additional file 6. The CEC, HDL-C, and CRP indexes waswas scored as “very low quality” because of risk of limitations, inconsistency and imprecision.
Strength and study limitations
Several potential limitations should be taken into consideration. First, the quality of the meta- and pooled analyses largely depended on the quality of the original studies. Among the studies included, there were six observational studies that were susceptible to selection and recall bias. Second, substantial heterogeneity was reported in this meta-analysis. Therefore, sensitivity analyses were conducted to confirm the stability of the results. Third, there is currently no established gold standard for ex vivo CEC assays. In addition, the rate of cholesterol efflux was expressed in various forms, leading to slight differences among the reported CEC values. Thus, to minimize the variation, the standardized effect size was calculated. Fourth, the small number of included studies can limit the ability to interpret the funnel plot.