Heterocyclic nucleus are considered essential in medicinal chemistry and provides a model for developing several therapeutic agents such as drugs with a wide antibacterial spectrum. In an attempt to obtain a new antibacterial agent, new quinolone derivatives containing triazole and thiadiazole have prepared via a straightforward method. The newly synthesized products' chemical structures have invistigated their FT-IR, 1H NMR, 13C NMR, and Mass techniques. A good yield was found for all the prepared derivatives varying from 74-79%. Molecular docking studies of the synthesized compounds showed only one compound, 6c, which has the same ranking from the in vitro and silicon test results on Gram-negative bacteria. Also, several compounds have close rankings, such as compound 5 (ranks 13 and 14) and compound 6c (ranks 6 and 5) in Gram-positive bacteria, as well as compound 7a (ranks 13 and 12), compound 7c (ranks 1 and 2), and compound 7d (ranks 12 and 13) in Gram-negative bacteria. However, there is one exciting compound, 7c, which shows very high rankings (ranks 1 and 2) in Gram-negative bacteria. This suggests that the compound has potential as an antimicrobial in Gram-negative bacteria, with an ampicillin-like mechanism of action targeting the bacteria's Penicillin-binding proteins.
Research Article
Design, Synthesis and Molecular Docking Study of Some Quinoline Derivatives
https://doi.org/10.21203/rs.3.rs-975354/v1
This work is licensed under a CC BY 4.0 License
Version 1
posted
You are reading this latest preprint version
Quinoline
heterocycles
synthesis
molecular docking
drug discovery
Quinoline represents a significant class of heterocycles. Quinoline is found in may natural products such as alkaloids and possess potent biological activities [1–3]. Nowadays, with the steady growth of bacterial resistance and the increase of multi-drug resistance, there is an urgent need to develop new antibacterial agents [4]. Heterocyclic compounds are established molecules in organic and medicinal chemistry, making them vital organic chemicals. The physicochemical properties of the heterocycle are determined principally via the type of heteroatom and the size of the ring, as well as the substituents on the lead structure [5–8]. Heterocyclic compounds have found application in numerous pharmacological areas such as anticancer [9], anti-inflammatory, and anticonvulsant [10]; however, nowadays, several heterocycles have displayed an effective antibacterial response [11, 12]. Among all the biologically active nitrogenated heterocyclic compounds, quinoline and its derivatives have attracted considerable studies because of their extensive distribution in nature and distinct synthetic routes [13]. Additionally, heterocycles are used as essential precursors for the design and synthesis of pharmacologically active compounds and in continuance with our previous work on the synthesis of compounds with pharmacological and biological applications [14–28], in this contribution, new quinoline derivatives bearing different heterocyclic moieties such as thiadiazine, triazole, and thiadiazoles were synthesized, and their molecular docking was investigated.
2.1. Materials and methods
Sigma-Aldrich and Alfa-Aesar provided all of the reagents and solvents utilized in this research. Micro heating table HMK 67/1825 Kuestner (Büchi Apparatus) has been used to determine the melting point of the synthesized derivatives. A Nicolet 205 has been used to acquire FT-IR spectra. TMS was employed as an internal standard in the NMR analysis, and the spectra were recorded on a Bruker Avance spectrometry (300 II, 2007). Advion expression S electrospray ionization mass spectrometer (ESI–MS) (Shimadzu Corporation, Kyoto, Japan) with a TLC interface was utilized to invistgate the Mass spectra.
2.2 Preparation of derivatives 6a-f
Aldehydes (0.005 mol) were dissolved in dry DMF (20 ml) and p-TsOH (0.2 g, 0.001 mole), then (1.59 g, 0.005 mole) of compound (5) was added to the mixture. The mixture was refluxed (14-15 hours) then left it to cool. Into the mixture, crushed ice was added and kept under stirring overnight. Finally, the mixture was filtrated, the precipitate was washed with water and a solution of ethanol/dioxane was used for recrcystalization to acquire the targets (6a-f).
6-(4-Bromophenyl)-3-{[(6-methoxy-2-methylquinolin-4-yl)oxy]methyl}-5,6-dihydro-[1,2,4]triazolo[3,4-b][1,3,4]thiadiazole(6e).

Yield: 75%; yellow crystals, M.p. 208-210oC. IR (KBr) [υ, cm−1]: 3340 (NH), 2951 (CH), 1630 (C=N). 1H NMR (300 MHz, CDCl3): δ=2.17 (s, 3H, CH3),3.62 (s, 3H, OCH3),4.20 (s, 1H, CH), 4.52 (s, 2H, OCH2),5.61 (s, 1H, NH), 6.72 (s, 1H, ArH), 7.11 (d, 2H, J=8.4Hz, ArH), 7.21 (d, 1H, J=2.9Hz, ArH), 7.26 (dd, 1H, J=2.7, 9.5Hz, ArH), 7.30-7.38 (m, 1H, ArH), 8.11 (d, 1H, J=9.1Hz, ArH), 8.25 (d, 1H, J=7.8Hz, ArH). 13C NMR (62.9 MHz, CDCl3): δ=32.1 (CH3), 55.2 (OCH3), 60.3 (OCH2), 112.1, 112.9, 120.9, 122.1, 123.2, 124.1 (CH), 125.2, 126.6, 129.4, 130.1, 130.2, 130.9 (C), 135.5 (CH), 137.5, 158.1, 159.0 (C). HRMS (ESI): [M+H]+ found, 483.0429; calcd for C21H19BrN5O2S, 483.0425.
6-(3,4-Dimethoxyphenyl)-3-{[(6-methoxy-2-methylquinolin-4-yl)oxy]methyl}-5,6-dihydro-[1,2,4]triazolo[3,4-b][1,3,4]thiadiazole(6f).

Yield: 76%; yellow crystals, M.p. 220-222oC. IR (KBr) [υ, cm−1]: 3361 (NH), 2919 (CH), 1635 (C=N). 1H-NMR (300 MHz, CDCl3): δ=2.17 (s, 3H, CH3),3.42, 3.63, 3.76 (s, 9H, 3OCH3),4.27 (s, 1H, CH), 4.54 (s, 2H, OCH2),5.67 (s, 1H, NH), 6.70 (s, 1H, ArH), 7.10 (d, 1H, J=8.0Hz, ArH), 7.20-7.23 (m, 1H, ArH), 7.24-7.27 (m, 1H, ArH), 7.32-7.35 (m, 1H, ArH), 8.10 (d, 1H, J=8.7Hz, ArH), 8.25 (d, 1H, J=7.8Hz, ArH). 13C NMR (75.5 MHz, CDCl3): δ=32.0 (CH3), 55.0, 59.9, 60.3 (3OCH3), 62.1 (OCH2), 103.7, 111.2, 116.4, 120.1, 122.3, 124.8, 124.9 (CH), 127.0, 127.3, 127.9, 129.3 139.2, 140.8, 144.1 (C), 146.6 (CH), 148.8, 153.1, 157.9 (C). HRMS (ESI): [M+H]+ found, 465.1548; calcd for C23H24N5O4S, 465.1544.
2.3. Preparation of derivatives 7a-g
Compound 5 (1.59 g, 0.005 mol) were mixed with different substituted isothiocyanates (0.005 mol) dissolved in dry DMF (10ml) and stirred under reflux for 18-20 hours. Crushed ice was added to the reaction mixture and stirred overnight. Filtration and washing were carried out followed by recrystallization from ethanol/ether to obtain the targets 7a-g.
N-(4-chlorophenyl)-3-{[(6-methoxy-2-methylquinolin-4-yl)oxy]methyl}-[1,2,4]triazolo[3,4-b][1,3,4]thiadiazol-6-amine7f .

Yield: 74%; M.p. 199-201oC. IR (KBr) [υ, cm−1]: 3350 (NH), 3065 (C=C aryl), 1627 (C=N). 1H NMR (300 MHz, CDCl3): δ=2.28 (s, 3H, CH3), 3.76 (s, 3H, OCH3),4.54 (s, 2H, OCH2), 6.70 (s, 1H, ArH), 7.11 (d, 1H, J=7.8Hz, ArH), 7.20-7.25 (m, 1H, ArH), 7.27-7.31 (m, 1H, ArH), 7.35 (dd, 1H, J=8.0, 3.5Hz, ArH), 7.52 (d, 1H, J= 8.1 Hz, ArH), 8.12 (d, 1H, J=7.9Hz, ArH), 8.28 (d, 1H, J=7.8Hz, ArH), 9.28 (s, 1H, NH). 13C NMR (62.9 MHz, CDCl3): δ=30.1 (CH3), 51.4 (OCH3), 60.4 (OCH2), 102.1, 117.6, 121.8, 122.8, 122.9 (CH), 123.1, 126.1, 127.4, 127.6, 128.0, 128.3 (C), 128.7 (CH), 129.6, 132.7, 136.0, 155.3 (C). HRMS (ESI): [M+H]+ found, 452.0872; calcd for C21H18ClN6O2S, 452.0867.
3-{[(6-Methoxy-2-methylquinolin-4-yl)oxy]methyl}-N-(p-tolyl)-[1,2,4]triazolo[3,4-b][1,3,4]thiadiazol-6-amine(7g).

Yield: 79%; M.p. 203-205oC. IR (KBr) [υ, cm−1]: 3379 (NH), 3058 (C=C aryl), 2982, 2953, 2863 (CH3 and CH2), 1637 (C=N). 1H NMR (300 MHz, CDCl3): δ=2.16, 2.41 (s, 6H, 2CH3), 3.85 (s, 3H, OCH3),4.61 (s, 2H, OCH2), 6.51 (s, 1H, ArH), 6.91-7.06 (m, 1H, ArH), 7.11 (dd, 1H, J=1.8, 8.5Hz, ArH), 7.32 (d, 1H, J=8.0Hz, ArH), 7.40 (d, 1H, J=8.0Hz, ArH), 7.61 (s, 1H, ArH), 8.30 (d, 1H, J=7.9Hz, ArH), 9.38 (s, 1H, NH). 13C NMR (75.5 MHz, CDCl3): δ=25.4, 28.7 (2CH3), 55.3 (OCH3), 60.3 (OCH2), 102.1, 116.6, 120.7, 120.9 (CH), 127.0, 127.6 (C), 128.4, 128.7 (CH), 129.2, 129.4, 129.8, 132.7, 133.6, 136.0, 141.2, 155.5 (C). HRMS (ESI): [M+H]+ found, 432.1492; calcd for C22H21N6O2S, 432.1487.
2.4. Preparation of derivatives 8a-e
In 50ml of ethanol, compound 5 (1.59 g, 0.005 mole) was added to substituted 2-bromoacetophenones (0.01 mol) and refluxed for 8-10 hours before cooling. The mixture was poured over ice and stirred overnight. To obtain 8a-e targets, the solid was washed with water and dried, then recrystallized from an ethanol/dioxane solution.
3-{[(6-Methoxy-2-methylquinolin-4-yl)oxy]methyl}-6-(p-tolyl)-7H-[1,2,4]triazolo[3,4-b][1,3,4]thiadiazine(8e).

Yield: 76%; M.p. 213-215oC. IR (KBr) [υ, cm−1]: 3064 (C=C aryl), 2972, 2861 (CH2), 1610 (C=N). 1H NMR (300 MHz, CDCl3): δ=2.27, 2.47 (s, 6H, 2CH3), 3.65 (s, 3H, OCH3),4.24 (s, 2H, CH2),4.60 (s, 2H, OCH2), 6.72 (s, 1H, ArH), 7.12 (d, 1H, J=8.0Hz, ArH), 7.31-7.39 (m, 1H, ArH), 7.41-7.48 (m, 1H, ArH), 7.54 (d, 1H, J= 9.7Hz, ArH), 7.81 (s, 1H, ArH), 8.13 (d, 1H, J=8.1Hz, ArH), 8.32 (d, 1H, J=7.8Hz, ArH). 13C NMR (75.5 MHz, CDCl3): δ=31.4, 32.7 (2CH3), 46.8 (CH2), 55.4 (OCH3), 62.3 (OCH2), 113.2, 116.1, 117.2, 123.3 (CH), 127.6, 128.0, 128.9 (C), 129.1, 129.3 (CH), 130.0, 133.6, 134.2, 134.8, 147.8, 152.6, 158.7 (C). HRMS (ESI): [M+H]+ found, 431.1460; calcd for C23H22N5O2S, 431.1456.
2.5. Docking Study
Toshiba Portege Z30C series Ultrabook with an Intel™ Core [email protected] GHz and Windows 10 Pro 64-bit operating system was used. ChemDraw Professional (20.0) was utilized for molecular modeling, Chem3D Ultra (20.0) for the minimization of energy, for ligand and conversion of receptor format was used OpenBabel (3.1.1), for the configuration of docking protocol was used AutoDockTools 1.5.7rc1, for the process of docking was used Autodock Vina (1.1.2), for the validation of the docking protocol was used PyMOL (2.4.1), for the preparation of docking results UCSF Chimera 1.15rc and for visualization and observation of docking results was used Discovery Studio Visualizer (20.1) [29–32]. The obtained data of three-dimensional receptor structures was obtained at www.rscb.org
Ligandʼs Preparation
The ligands test was consisted of 14 quinoline-based heterocyclic derivatives as test compounds, while the reference ligand was ampicillin. The two-dimensional structure was sketched, and energy minimization was carried out with the Merck Molecular Force Field (MMFF94) [33]. The format of optimized structure was converted from *.hin to *.pdb, using AutoDockTools 1.5.7rc1, the charge and torque of the ligands were given by default.
Receptors Preparation
Penicillin-binding proteins (PBPs) were used as receptors, which represent two types of Gram-positive and negative bacteria, consisting of S. aureus (PDB ID 3HUN) and E. coli (PDB ID 2EX6). The two receptors used to form a complex with ampicillin, which is used as the reference ligand, are consistent with the in vitro test carried out. Both receptors have a resolution of not more than 2 Å, with Ramachandran outliers not more than 0.2% [34, 35].
Docking Protocol Validation
Docking protocol validation was carried out based on the method reported by Pratama et al. [36]. PyMOL 2.4.1 was used for investigation of the root-mean-square deviation (RMSD), If an RMSD value of no more than 2 Å is attained, then the docking protocol is valid.
Molecular Docking
The docking process is carried out with a previously validated protocol. Three times replication for the docking process and ΔG is used and the limit values of the standard deviation to be 0.12 kcal/mol maximum. *.pdb format using Chimera 1.15rc was utilized for storing the ligand pose that has lowest ΔG. Discovery Studio Visualizer (19.1.0). was used in order to investigate two-dimensional analyses. Discovery Studio Visualizer (19.1.0) was used to perform two-dimensional analyses of docking results. There are two parameters observed including the difference ΔG and the similarity of amino acid interactions, both of which are compared with reference ligands. The method of determining both is carried out as reported by Pratama et al. [37].
3.1. Chemistry
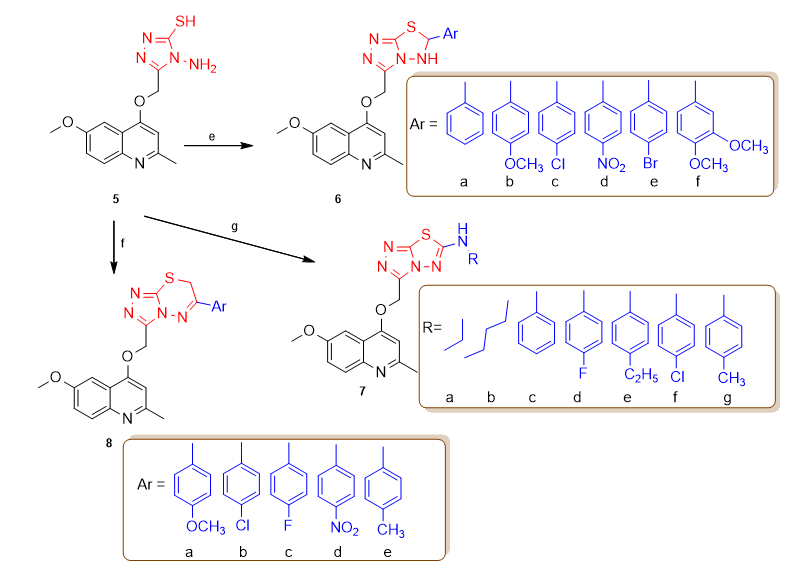
The quinolones preparation was displayed in Scheme 1. Compound 2 was obtained by mixing compound 1 with ethyl acetoacetate under reflux for 6 h [38]. Compound 3 was obtained from thermal cyclization at 260oC of compound 2 for one hour. Compound 4 was resulted when compound 3 was mixed with chloroacetic acid [39, 40]. The reaction of compound 4 with thiocarbohydrazide at a higher temperature 170-180oC generated compound 5, which is our starting material. New derivatives 6a-f were obtained from mixing compound 5 with aldehydes and p-TsOH [41]. Additionally, good yields of compounds 7a-g were obtained from heating of compound 5 in the presence of isothiocyanates. Furthermore, compound 5 reacted with different 2-bromoacetophenones in absolute ethanol to produce high yields of 8a-e derivatives.
Reagents and conditions: (a) Ethyl acetoacetate, EtOH, 100°C, 6 h. (b) 260°C, 1h, (c) chloroacetic acid, K2CO3, stirring at 80°C for 5 h. (d) 4, thiocarbohydrazide, 170-180oC, 1 h. (e) aldehydes, P-TsOH, dry DMF, reflux, 14-15h. (f) 5, substituted 2-bromoacetophenones, EtOH, reflux, 6-8h. (g) 5, isothiocyanates, dry DMF, reflux, 18-20h.
3.2. Structural Analysis
Spectroscopic analyses such as 1H-NMR and FT-IR were used to distinguish between the two tautomeric forms of compound 5, which involves thione-thiol. Two singlet signals (integrating two protons) were observed at 5.67 and 13.33 ppm in 1H-NMR spectra of compound 5, denoted to the proton of NH2 and SH, respectively. In accordance with the structure of the compounds, other signals were invistigated and displaying the anticipated protons number (integration value). A characteristic peak (2600 cm−1) was observed in FT-IR spectra belonging to SH group. Two protons from the amine group (NH2) disappeared from the 1H-NMR spectra of compounds 6a-f, and two new bands with one proton integration developed. The chemical shift at 4.22-4.25 ppm is ascribed to CH; however, the one at 5.62-5.78 ppm is attributed to the NH group. Furthermore, signals at 3.42 and 3.76 ppm displaying integration values of six protons belonging to the OCH3 group were obtained. Compounds 7a-g displayed 1H-NMR spectra with no signals corresponding to NH2 and SH; however, single hydrogen proton attributed to alkyl/aryl amino apeeard to have a peak at 9.28-9.58 ppm demonstrating that compounds 7a-g were obtained from compound 5 undergoing intramolecular cyclization. Additional protons related to p-tolyl derivative at 2.41 ppm were confirmed for compound 7g. The targets 8a-e were confirmed by 1H-NMR analysis, which revealed two hydrogen signals at 4.17-4.28 ppm attributed to CH2 group. The redocking process was carried out, and the obtained values for the 3HUN and 2EX6 receptors were 1.828 Å and 1.762 Å, respectively, indicating validation of docking purposes. Figure 1. displays the obtained ligands from the overlays with co-crystal ligands of crystallographic. ΔG and amino acid interactions, size and grid box coordination are the parameters noticed in the validation step (Table 1).
|
Parameters |
Value |
|
|---|---|---|
|
PDB ID |
3HUN |
2EX6 |
|
Co-crystal ligand |
Ampicillin |
Ampicillin |
|
Grid box size (Å) |
22 x 20 x 16 |
20 x 14 x 16 |
|
Grid box position |
x: -23.919 y: 3.110 z: -0.079 |
x: 88.833 y: -3.911 z: 43.207 |
|
RMSD (Å) |
1.828 |
1.762 |
|
ΔG (kcal/mol) |
-7.67 ± 0.06 |
-7.6 ± 0.0 |
|
Amino acid residues |
74-Alaa 75-Serb 114-Gluc 115-Leub 116-Serc 139-Serb 141-Asnb 182-Alaa 241-Phed 261-Glyb 262-Serc 263-Serb 268-Tyrb 291-Tyrb 297-Glue |
62-Serc 65-Lyse 155-Aspb 160-Phef 305-Lysb 306-Serc 308-Asnc 359-Leub 398-Serb 417-Lysg 418-Thrc 419-Glyb 420-Serc 421-Sera |
| aAlkyl/Pi-alkyl interaction; bVan der Waals interaction; cHydrogen bond; dPi-Sigma; eUnfavorable Bump/Donor-donor; fPi-Pi T-shaped/Pi-Pi Stacked/Amide-Pi stacked; gPi-Sulfur | ||
For the two receptors,the docking of all the ligands yielded varied findings, but they were all consistent. At the 3HUN receptor, the lowest ΔG value was shown by ligand 6b with -9.67 kcal/mol, while at the 2EX6 receptor, it was shown by ligand 6a with ΔG -8.77 kcal/mol. In general, all the 6 ligand variants exhibit very low ΔG values at the 3HUN receptor. However, the 2EX6 receptor for ligand 6a shows a much lower ΔG value than the other ligand 6 variants. More mixed results were shown in the ligand 7 variant, where some ligands had a fairly low ΔG value, but some were even higher than the reference ligands. In the ligand 8 variant, promising results were shown for the 8d ligand, which showed the lowest ΔG value for both receptors, not even much different from the ligand 6 variant. Meanwhile, ligand 5 shows a higher ΔG value than the reference ligand at both receptors. The ΔG value is often used to reference a ligand's affinity to the receptor active site, although this value has yet to be compared again with both reference and decoy ligands [42].
The similarity of all the test ligand-ligand receptor interactions to the two receptors was rather atrong ranging from 39.29 to 76.67%. The highest similarity to the 3HUN receptor was shown by the ligand 7c, while the 2EX6 receptor was shown by ligands 7a and 7d. It can be seen that if the ΔG value is dominated by ligand 6, in the interaction similarity, the ligand 7 variant dominates the highest rank. The ligand 6 variant itself only has a similarity range in the two receptors ranging from 39.29 - 67.86%. Basically, the higher the similarity of the ligand-receptor interaction will show the possibility of similarity of the mechanism of action with reference ligand, although it still has to be proven again by molecular dynamic simulation [43]. Tables 2 and 3 provide the complete results of the docking process at the two receptors, whereas figures 2 and 3 show two-dimensional interactions of ligands with the lowest ΔG values.
|
Ligand |
5 |
6a |
6b |
6c |
6d |
7a |
7b |
7c |
7d |
7e |
8a |
8b |
8c |
8d |
|---|---|---|---|---|---|---|---|---|---|---|---|---|---|---|
|
ΔG (kcal/mol) |
-7.43 ±0.06 |
-9.50 ±0.00 |
-9.67 ±0.06 |
-9.27 ±0.06 |
-9.50 ±0.00 |
-7.67 ±0.06 |
-7.90 ±0.00 |
-8.87 ±0.06 |
-7.57 ±0.06 |
-9.00 ±0.00 |
-8.57 ±0.06 |
-8.20 ±0.00 |
-8.50 ±0.00 |
-9.40 ±0.00 |
|
Amino acid residues |
72-Asna |
72-Asna |
72-Asna |
72-Asna |
72-Asna |
- |
- |
72-Asna |
- |
72-Asna |
- |
- |
- |
- |
|
74-Alaa |
74-Alaa |
74-Alaa |
74-Alaa |
74-Alab |
74-Alaa |
74-Alaa |
74-Alab |
74-Alaa |
74-Alab |
74-Alab |
74-Alaa |
74-Alab |
- |
|
|
75-Serc |
75-Sera |
75-Sera |
75-Sera |
75-Sera |
75-Serd |
75-Serd |
75-Sera |
75-Serd |
75-Sera |
75-Serd |
75-Serd |
75-Serd |
75-Sera |
|
|
- |
- |
- |
- |
- |
- |
- |
- |
- |
- |
- |
- |
- |
78-Lysa |
|
|
114-Glud |
114-Glud |
114-Glud |
114-Glud |
114-Glud |
114-Glua |
114-Glua |
114-Glud |
114-Glua |
114-Glua |
114-Glua |
114-Glua |
114-Glua |
114-Glua |
|
|
115-Leua |
115-Leua |
115-Leua |
115-Leua |
115-Leua |
115-Leua |
115-Leua |
115-Leua |
115-Leua |
115-Leua |
115-Leua |
115-Leua |
115-Leua |
115-Leud |
|
|
116-Sera |
116-Sera |
116-Sera |
116-Sera |
116-Sera |
116-Serd |
116-Serd |
116-Serc |
116-Serd |
116-Serc |
116-Serd |
116-Serd |
116-Serd |
116-Serd |
|
|
- |
- |
- |
- |
- |
- |
- |
- |
- |
- |
- |
- |
- |
117-Asnd |
|
|
- |
- |
- |
- |
- |
- |
- |
- |
- |
- |
138-Asnd |
138-Asnd |
138-Asnd |
138-Asna |
|
|
139-Sera |
139-Sera |
139-Sera |
139-Sera |
139-Sera |
139-Sera |
139-Sera |
139-Sera |
139-Sera |
139-Sera |
139-Sera |
139-Sera |
139-Sera |
139-Sera |
|
|
- |
- |
- |
- |
- |
- |
- |
141-Asna |
- |
141-Asna |
- |
- |
- |
141-Asnd |
|
|
- |
- |
- |
- |
- |
- |
- |
- |
- |
- |
- |
- |
- |
180-Thra |
|
|
181-Glya |
181-Glya |
181-Glya |
181-Glya |
181-Glya |
- |
- |
181-Glye |
- |
181-Glya |
- |
- |
- |
- |
|
|
182-Alab |
182-Alad |
182-Alad |
182-Alab |
182-Alad |
- |
- |
182-Alad |
- |
182-Alaa |
- |
- |
- |
182-Alab |
|
|
183-Glua |
183-Glud |
183-Glud |
183-Glud |
183-Glud |
- |
- |
- |
- |
183-Glua |
- |
- |
- |
- |
|
|
186-Arga |
186-Arga |
186-Arga |
186-Arga |
186-Arga |
- |
- |
- |
- |
- |
- |
- |
- |
- |
|
|
241-Phea |
241-Phef |
241-Phef |
241-Phef |
241-Phef |
241-Phef |
241-Phef |
241-Phef |
241-Phef |
241-Phef |
241-Phef |
241-Phef |
241-Phef |
241-Phef |
|
|
259-Lysa |
259-Lysa |
259-Lysa |
259-Lysa |
259-Lysa |
- |
- |
- |
- |
- |
- |
- |
- |
- |
|
|
260-Thrd |
260-Thrd |
260-Thrd |
260-Thrd |
260-Thrd |
260-Thra |
260-Thra |
- |
260-Thra |
- |
260-Thra |
260-Thra |
260-Thra |
260-Thra |
|
|
261-Glya |
261-Glya |
261-Glya |
261-Glya |
261-Glya |
261-Glya |
261-Glya |
261-Glya |
261-Glya |
261-Glya |
261-Glya |
261-Glya |
261-Glya |
261-Glya |
|
|
262-Sera |
262-Sera |
262-Sera |
262-Sera |
262-Sera |
262-Sera |
262-Sera |
262-Sera |
262-Sera |
262-Sera |
262-Sera |
262-Sera |
262-Sera |
262-Sera |
|
|
263-Sera |
263-Sera |
263-Sera |
263-Sera |
263-Sera |
263-Sera |
263-Sera |
263-Sera |
263-Sera |
263-Sera |
263-Sera |
263-Sera |
263-Sera |
263-Sera |
|
|
- |
- |
- |
- |
- |
- |
- |
- |
- |
- |
- |
- |
- |
264-Aspa |
|
|
268-Tyra |
- |
- |
- |
- |
268-Tyra |
268-Tyra |
- |
268-Tyra |
- |
268-Tyra |
268-Tyra |
268-Tyra |
268-Tyra |
|
|
291-Tyra |
- |
- |
- |
- |
291-Tyra |
291-Tyra |
291-Tyra |
291-Tyra |
291-Tyra |
291-Tyra |
291-Tyra |
- |
291-Tyra |
|
|
297-Glua |
297-Glua |
297-Glua |
297-Glua |
297-Glua |
297-Glud |
297-Glud |
297-Glua |
297-Glud |
297-Glua |
297-Glud |
297-Glud |
297-Glud |
297-Glua |
|
|
300-Arga |
300-Arga |
300-Arga |
300-Arga |
300-Arga |
300-Arga |
300-Arga |
- |
300-Arga |
- |
300-Arga |
300-Arga |
300-Arga |
300-Arga |
|
|
Amino acids and co-crystal ligand similarity (%) |
93.33 |
80 |
80 |
80 |
80 |
86.67 |
86.67 |
93.33 |
86.67 |
93.33 |
86.67 |
86.67 |
80 |
93.33 |
|
The similarity in the type of interaction with co-crystal ligand (%) |
53.33 |
40 |
40 |
46.67 |
46.67 |
46.67 |
46.67 |
60 |
46.67 |
53.33 |
53.33 |
46.67 |
46.67 |
53.33 |
|
The similarity of ligand-receptor interaction* (%) |
73.33 |
60 |
60 |
63.33 |
63.33 |
66.67 |
66.67 |
76.67 |
66.67 |
73.33 |
70 |
66.67 |
63.33 |
73.33 |
| aVan der Waals interaction; bAlkyl/Pi-alkyl interaction; cUnfavorable Bump/Donor-donor; dHydrogen bond; eHalogen; fPi-Pi T-shaped/Pi-Pi Stacked/Amide-Pi stacked; *(Similarity of amino acids + similarity in type of interaction)/2 | ||||||||||||||
|
Ligand |
5 |
6a |
6b |
6c |
6d |
7a |
7b |
7c |
7d |
7e |
8a |
8b |
8c |
8d |
|---|---|---|---|---|---|---|---|---|---|---|---|---|---|---|
|
ΔG (kcal/mol) |
-7.40 ±0.00 |
-8.77 ±0.06 |
-8.10 ±0.00 |
-8.00 ±0.10 |
-8.33 ±0.06 |
-7.80 ±0.00 |
-8.57 ±0.12 |
-8.63 ±0.06 |
-7.67 ±0.12 |
-8.43 ±0.12 |
-8.60 ±0.00 |
-8.40 ±0.00 |
-8.60 ±0.00 |
-8.63 ±0.06 |
|
Amino acid residues |
61-Alaa |
61-Alaa |
61-Alab |
61-Alab |
61-Alab |
61-Alaa |
61-Alaa |
61-Alaa |
61-Alaa |
61-Alaa |
61-Alaa |
61-Alaa |
61-Alaa |
61-Alaa |
|
62-Serc |
62-Sera |
62-Sera |
62-Serc |
62-Sera |
62-Sera |
62-Sera |
62-Sera |
62-Serc |
62-Sera |
62-Sera |
62-Sera |
62-Sera |
62-Sera |
|
|
65-Lysa |
- |
- |
- |
- |
65-Lysa |
65-Lysa |
- |
- |
65-Lysa |
65-Lysd |
- |
- |
- |
|
|
- |
- |
152-Proa |
152-Proa |
152-Proa |
152-Proa |
152-Proa |
- |
152-Proa |
- |
- |
- |
- |
||
|
- |
- |
- |
154-Asna |
- |
- |
- |
- |
- |
- |
- |
- |
- |
- |
|
|
155-Aspe |
155-Aspe |
155-Aspe |
155-Aspc |
155-Aspa |
- |
155-Aspe |
155-Aspe |
155-Aspe |
155-Aspe |
- |
- |
- |
155-Aspa |
|
|
- |
- |
- |
- |
- |
- |
- |
159-Cysa |
- |
159-Cysb |
159-Cysb |
159-Cysa |
159-Cysb |
159-Cysa |
|
|
160-Phef |
160-Phef |
160-Phef |
160-Phef |
160-Phea |
160-Phef |
160-Phef |
160-Phef |
160-Phef |
160-Phef |
160-Phef |
160-Phef |
160-Phef |
160-Phef |
|
|
- |
171-Arga |
171-Arga |
- |
171-Argc |
- |
171-Arga |
171-Arga |
171-Arga |
171-Arga |
171-Arga |
171-Arga |
171-Arga |
171-Arga |
|
|
305-Lysa |
305-Lysa |
- |
- |
- |
305-Lysa |
- |
- |
305-Lysa |
- |
305-Lysa |
305-Lysa |
305-Lysa |
305-Lysa |
|
|
306-Serc |
306-Sera |
306-Sera |
306-Sera |
306-Sera |
306-Sera |
306-Serc |
306-Serc |
306-Serc |
306-Serc |
306-Sera |
306-Sera |
306-Sera |
306-Sera |
|
|
- |
307-Aspa |
307-Aspa |
307-Aspa |
307-Aspa |
- |
307-Aspa |
307-Aspa |
307-Aspa |
307-Aspa |
307-Aspa |
307-Aspa |
307-Aspa |
307-Aspa |
|
|
308-Asnc |
308-Asnc |
308-Asnc |
308-Asnc |
308-Asnc |
308-Asnc |
308-Asnd |
308-Asnd |
308-Asnc |
308-Asnd |
308-Asnc |
308-Asnc |
308-Asnc |
308-Asnc |
|
|
- |
- |
- |
- |
309-Meta |
- |
- |
- |
- |
- |
- |
- |
- |
- |
|
|
358-Glyc |
358-Glyc |
- |
358-Glya |
358-Glya |
358-Glyc |
- |
- |
358-Glyc |
- |
- |
- |
- |
- |
|
|
359-Leua |
359-Leua |
359-Leua |
359-Leub |
359-Leug |
359-Leua |
359-Leua |
359-Leua |
359-Leua |
359-Leua |
359-Leua |
359-Leua |
359-Leua |
359-Leua |
|
|
361-Arga |
- |
- |
361-Arga |
361-Arga |
- |
361-Arga |
361-Arga |
361-Arga |
361-Arga |
- |
- |
- |
- |
|
|
- |
- |
- |
- |
- |
398-Sera |
- |
- |
- |
- |
- |
- |
- |
- |
|
|
- |
417-Lysa |
- |
- |
- |
417-Lysa |
- |
- |
417-Lysa |
- |
- |
- |
- |
- |
|
|
- |
418-Thra |
- |
- |
- |
418-Thra |
418-Thra |
418-Thra |
418-Thra |
418-Thra |
418-Thra |
418-Thra |
418-Thra |
||
|
- |
419-Glya |
419-Glya |
419-Glya |
- |
419-Glya |
419-Glya |
419-Glya |
419-Glya |
419-Glya |
419-Glya |
419-Glya |
419-Glya |
419-Glya |
|
|
420-Serc |
420-Serc |
420-Sera |
420-Sera |
420-Serc |
420-Sera |
420-Serc |
420-Sera |
420-Serd |
420-Serc |
420-Serc |
420-Serc |
420-Serc |
420-Serc |
|
|
421-Serb |
421-Serb |
421-Serb |
421-Serg |
421-Serg |
421-Serb |
421-Serb |
421-Serb |
421-Serb |
421-Serb |
421-Serb |
421-Serb |
421-Serb |
421-Serb |
|
|
- |
- |
422-Glna |
- |
- |
- |
- |
- |
- |
- |
- |
- |
- |
- |
|
|
Amino acids and co-crystal ligand similarity (%) |
71.43 |
85.71 |
64.29 |
64.29 |
57.14 |
92.86 |
78.57 |
71.43 |
85.71 |
78.57 |
78.57 |
71.43 |
71.43 |
78.57 |
|
The similarity in the type of interaction with co-crystal ligand (%) |
57.14 |
50 |
35.71 |
28.57 |
21.43 |
50 |
42.86 |
35.71 |
57.14 |
42.86 |
57.14 |
50 |
50 |
57.14 |
|
The similarity of ligand-receptor interaction* (%) |
64.29 |
67.86 |
50 |
46.43 |
39.29 |
71.43 |
60.71 |
53.57 |
71.43 |
60.71 |
67.86 |
60.71 |
60.71 |
67.86 |
| aVan der Waals interaction; bAlkyl/Pi-alkyl interaction; cHydrogen bond; dUnfavorable Bump/Donor-donor; ePi-Cation/Anion; fPi-Pi T-shaped/Pi-Pi Stacked/Amide-Pi stacked; gPi-Sigma *(Similarity of amino acids + similarity in type of interaction)/2 | ||||||||||||||
Observations of the docking results for these two parameters are then presented in a two-dimensional graph, as presented in Figure 4. It can be seen that all test ligands are more dominant in the difference between the ΔG to reference ligand at the 3HUN receptor compared to 2EX6, which is shown on the left in the diagram. The same is true for the similarity of ligand-receptor interactions, where almost all test ligands except 6a, 7a, and 7d show a higher interaction similarity to the reference ligand at the 3HUN receptor than 2EX6.
The molecular docking results are then juxtaposed with the previously obtained in vitro results and ranked in Table 4. It can be seen how the relationship between the in vitro and silico test results, whether there is a linear relationship between the two or not. However, only one compound, 6c, has the same ranking from the in vitro and silico test results on Gram-negative bacteria. Also, several compounds have close rankings between the two, such as compound 5 (ranks 13 and 14) and compound 6c (ranks 6 and 5) in Gram-positive bacteria, as well as compound 7a (ranks 13 and 12), compound 7c (ranks 1 and 2), and compound 7d (ranks 12 and 13) in Gram-negative bacteria. For the rest, the difference between the in vitro and silico rankings of the tested compounds was quite far; some were even opposite, as shown by compounds 6b, 7a, and 7d, which differed by more than 10 ranks.
Still, this does not necessarily indicate that the in vitro and silico results are not related. For compounds with high in vitro but low in silico ranking, it is likely because the target mechanism of action for these compounds is not the penicillin-binding proteins used in molecular docking [44, 45]. However, there is one exciting compound, 7c, which shows very high rankings (ranks 1 and 2) in Gram-negative bacteria. This suggests that the compound has potential as an antimicrobial in Gram-negative bacteria, with an ampicillin-like mechanism of action targeting the bacteria's Penicillin-binding proteins.
|
Compounds |
Ranking |
|||
|---|---|---|---|---|
|
Gram-positive |
Gram-negative |
|||
|
In vitro |
In silico |
In vitro |
In silico |
|
|
5 |
13 |
14 |
7 |
14 |
|
6a |
9 |
2 |
9 |
1 |
|
6b |
11 |
1 |
6 |
10 |
|
6c |
6 |
5 |
11 |
11 |
|
6d |
8 |
3 |
5 |
9 |
|
7a |
1 |
12 |
13 |
12 |
|
7b |
3 |
11 |
3 |
6 |
|
7c |
5 |
7 |
1 |
2 |
|
7d |
2 |
13 |
12 |
13 |
|
7e |
4 |
6 |
2 |
7 |
|
8a |
14 |
8 |
14 |
5 |
|
8b |
7 |
10 |
10 |
8 |
|
8c |
12 |
9 |
8 |
4 |
|
8d |
10 |
4 |
4 |
3 |
Novel heterocyclic nucleus of quinoline derivatives were prepared with good yields ranging from 74-79% via fascinating synthetic reaction, and their chemical structures were identified using NMR, Mass and FT-IR techniques. Molecular docking studies of the synthesized compounds showed only one compound, 6c, which has the same ranking from the in vitro and silico test results on Gram-negative bacteria. Furthermore, exciting compound 7c showed very high rankings (ranks 1 and 2) in Gram-negative bacteria. This suggests that the compound has potential as an antimicrobial in Gram-negative bacteria.
Acknowledgments
Many thanks and appreciations to the University of Technology and Mustansiriyah University for providing facilities as well as financial assistance. Dr. Ahmed Mahal would like also to express his gratitude to the Chinese Academy of Sciences (CAS President's International Fellowship Initiative (2016PM032)) and Cihan University-Erbil for their finicial support.
- Kerru, N., Gummidi, L., Maddila, S., Gangu, K. K., & Jonnalagadda, S. B. (2020). A review on recent advances in nitrogen-containing molecules and their biological applications. Molecules, 25(8), 1909. doi:10.3390/molecules25081909
- Ahmed, A., Daneshtalab, M. (2012). Polycyclic Quinolones (Part 1)-Thieno [2, 3-b] benzo-[h] quinoline Derivatives: Design, Synthesis, Preliminary in vitro and in silico Studies. Heterocycles, 85(1), 103. doi: 10.3987/COM-11-12374
- Shang, X. F., Morris‐Natschke, S. L., Liu, Y. Q., Guo, X., Xu, X. S., Goto, M., Li, J. C., Yang, G. C., Lee, K. H. (2018). Biologically active quinoline and quinazoline alkaloids part I. Med. Res. Rev., 38(3), 775-828. doi: 10.1002/med.21466.
- Teng, P., Li, C., Peng, Z., Marie, V. A., Nimmagadda, A., Su, M., Li, Y., Sun, X., Cai, J. (2018). Facilely accessible quinoline derivatives as potent antibacterial agents. Bioorg. Med. Chem., 26(12), 3573-3579. doi: 10.1016/j.bmc.2018.05.031.
- Fu, H. G., Li, Z. W., Hu, X. X., Si, S. Y., You, X. F., Tang, S., Wang, Y. S., Song, D. Q. (2019). Synthesis and biological evaluation of quinoline derivatives as a novel class of broad-spectrum antibacterial agents. Molecules, 24(3), 548. doi: 10.3390/molecules24030548.
- Martins, P., Jesus, J., Santos, S., Raposo, L. R., Roma-Rodrigues, C., Baptista, P. V., Fernandes, A. R. (2015). Heterocyclic anticancer compounds: recent advances and the paradigm shift towards the use of nanomedicine's tool box. Molecules, 20(9), 16852-16891. doi:10.3390/molecules200916852.
- Gomtsyan, A. (2012). Heterocycles in drugs and drug discovery. Chem. Heterocycl. Compd., 48(1), 7-10.
- Broughton, H. B., Watson, I. A. (2004). Selection of heterocycles for drug design. J. Mol. Graph. Model., 23(1), 51-58. doi: 10.1016/j.jmgm.2004.03.016.
- Gomha, S. M., Abdelaziz, M. R., Kheder, N. A., Abdel-Aziz, H. M., Alterary, S., Mabkhot, Y. N. (2017). A facile access and evaluation of some novel thiazole and 1, 3, 4-thiadiazole derivatives incorporating thiazole moiety as potent anticancer agents. Chem. Cent. J., 11(1), 1-8. doi: 10.1186/s13065-017-0335-8
- El-Sawy, E. R., Ebaid, M. S., Abo-Salem, H. M., Al-Sehemi, A. G., Mandour, A. H. (2014). Synthesis, anti-inflammatory, analgesic and anticonvulsant activities of some new 4, 6-dimethoxy-5-(heterocycles) benzofuran starting from naturally occurring visnagin. Arab. J. Chem., 7(6), 914-923. doi: 10.1016/j.arabjc.2012.12.041
- Mustafa, Y. F. (2018). Synthesis, characterization and antibacterial activity of novel heterocycle, coumacine, and two of its derivatives. Saudi Pharm. J., 26(6), 870-875. doi: 1016/j.jsps.2018.03.010
- Sureshkumar, B., Mary, Y. S., Panicker, C. Y., Suma, S., Armaković, S., Armaković, S. J., Alsenoy, C. V., Narayana, B. (2020). Quinoline derivatives as possible lead compounds for anti-malarial drugs: spectroscopic, DFT and MD study. Arab. J. Chem., 13(1), 632-648. doi: 10.1016/j.arabjc.2017.07.006
- Xiang, J. C., Wang, Z. X., Cheng, Y., Xia, S. Q., Wang, M., Tang, B. C., Wu, Y. D., Wu, A. X. (2017). Divergent synthesis of functionalized quinolines from aniline and two distinct amino acids. J. Org. Chem., 82(17), 9210-9216. doi:1021/acs.joc.7b01501
- Zinad, D. S., Mahal, A., Mohapatra, R. K., Sarangi, A. K., & Pratama, M. R. F. (2020). Medicinal chemistry of oxazines as promising agents in drug discovery. Chem. Biol. Drug Des., 95(1), 16-47. doi:1111/cbdd.13633
- Ansideri, F., Macedo, J. T., Eitel, M., El-Gokha, A., Zinad, D. S., Scarpellini, C., Kudolo, M., Schollmeyer, D., Boeckler, M., Koch, P. (2018). Structural Optimization of a Pyridinylimidazole scaffold: shifting the selectivity from p38α mitogen-activated protein kinase to c-Jun N-terminal kinase 3. ACS omega, 3(7), 7809-7831. doi: 10.1021/acsomega.8b00668
- Salman, G. A., Zinad, D. S., & Mahal, A. (2020). Design, synthesis, and biological evaluation of new quinoline-based heterocyclic derivatives as novel antibacterial agents. Monatsh. Chem. Chem. Mon., 151(10), 1621-1628. doi: 1007/s00706-020-02686-3
- Zinad, D. S., Mahal, A., Siswodihardjo, S., Pratama, M. R. F., & Mohapatra, R. (2021). 3D-Molecular Modeling, Antibacterial Activity and Molecular Docking Studies of Some Imidazole Derivatives. Egypt J. Chem., 64(1), 93-105. doi: 21608/EJCHEM.2020.31043.2662
- Mahal, A., Wu, P., Jiang, Z. H., Wei, X. (2017). Synthesis and cytotoxic activity of novel tetrahydrocurcumin derivatives bearing pyrazole moiety. Nat. Prod. Bioprospect., 7(6), 461-469. doi:10.1007/s13659-017-0143-9
- Mahal, A., Wu, P., Jiang, Z. H., Wei, X. (2019). Schiff bases of tetrahydrocurcumin as potential anticancer agents. ChemistrySelect, 4(1), 366-369. doi: 10.1002/slct.201803159
- Mahal, A., Duan, M., Zinad, D. S., Mohapatra, R. K., Obaidullah, A. J., Wei, X., Pradhan, M. K., Das, D., Kandi, V., Zinad, S., Zhu, Q. (2021). Recent progress in chemical approaches for the development of novel neuraminidase inhibitors. RSC Adv., 11(3), 1804-1840. doi: 10.1039/d0ra07283d
- Duan, M, Mahal, A, Mohammed, B, Zhu, Y, Tao, H, Mai, S, Al-Haideri, M, Zhu, Q. (2021). Synthesis and antitumor activity of new tetrahydrocurcumin derivatives viaclick reaction, https://doi.org/10.1080/14786419.2021.1931181
- Zinad, SD, Mahal, A, Al-Amiery, A. (2020). An efficient synthesis of novel imidazo-aminopyridinyl derivatives from 2-chloro-4-cyanopyridine, Org. Prep. Proc. Int. 52(4), 361-367; https://doi.org/10.1080/00304948.2020.1767491
- Zinad, SD, Shareef, OA, Mahal, A. (2020). Theoretical investigation for synthesis and characterization of two novel disubstituted imidazoles using microwave, AIP Conference Proceedings, 2213(1), 020188; https://doi.org/10.1063/5.0000128
- Zinad, SD, Mahal, A, Shareef, OA. (2020). Antifungal activity and theoretical study of synthesized pyrazole-imidazole hybrids. IOP Conference Series: Materials Science and Engineering 770 (1), 012053; https://doi:10.1088/1757-899X/770/1/012053
- Yang, L, Mahal, A, Liu, Y, Li, H, Wu, P, Xue, J, Xu, L, Wei, X. (2017). Two new 2, 5-diketopiperazines produced by Streptomyces sp. SC0581. Phytochemistry Letters 20, 89-92; https://doi.org/10.1016/j.phytol.2017.04.012
- Mahal, A, D’Errico, S, Borbone, N, Pinto, B, Secondo, A, Costantino, V, Tedeschi, V, Oliviero, G, Piccialli, V, Piccialli, G. (2015). Synthesis of cyclic N1-pentylinosine phosphate, a new structurally reduced cADPR analogue with calcium-mobilizing activity on PC12 cells. Beilstein journal of organic chemistry. 11(1), 2689-2695; https://doi.org/10.3762/bjoc.11.289
- Mahal, A. (2015). Synthesis, Characterization and Antifungal Activity of Some Metal Complexes Derived From Quinoxaloylhydrazone. World Journal of Organic Chemistry 3 (1), 1-8; https://doi.org/10.12691/wjoc-3-1-1
- Mahal, A. (2015). Oxetanes as versatile building blocks in the total synthesis of natural products: An overview. European Journal of Chemistry 6 (3), 357-366; https://doi.org/10.5155/eurjchem.6.3.357-366.1267
- Trott, O., Olson, A. J., AutoDock, V. (2010). Improving the speed and accuracy of docking with a new scoring function, efficient optimization and multithreading. J Comput. Chem., 31(2):455-61. doi:10.1002/jcc.21334
- O'Boyle, N. M., Banck, M., James, C. A., Morley, C., Vandermeersch, T., & Hutchison, G. R. (2011). Open Babel: An open chemical toolbox. J. cheminform., 3(1), 1-14. doi:10.1186/1758-2946-3-33
- Yuan, S., Chan, H. S., & Hu, Z. (2017). Using PyMOL as a platform for computational drug design. Wiley Interdisciplinary Reviews: Comput.l Mol. Sci., 7(2), e1298.doi:10.1002/wcms.1298
- Pettersen, E. F., Goddard, T. D., Huang, C. C., Couch, G. S., Greenblatt, D. M., Meng, E. C., Ferrin, T. E. (2004). UCSF Chimera-a visualization system for exploratory research and analysis. J. comput. chem., 25(13), 1605-1612.doi:10.1002/jcc.20084
- Floresta, G., Amata, E., Barbaraci, C., Gentile, D., Turnaturi, R., Marrazzo, A., & Rescifina, A. (2018). A structure-and ligand-based virtual screening of a database of "Small" marine natural products for the identification of "Blue" Sigma-2 receptor ligands. Mar. drugs, 16(10), 384.doi:10.3390/md16100384
- Navratna, V., Nadig, S., Sood, V., Prasad, K., Arakere, G., & Gopal, B. (2010). Molecular basis for the role of Staphylococcus aureus penicillin binding protein 4 in antimicrobial resistance. J. bacteriol., 192(1), 134-144.doi:10.1128/jb.00822-09
- Kishida, H., Unzai, S., Roper, D. I., Lloyd, A., Park, S. Y., & Tame, J. R. (2006). Crystal structure of penicillin binding protein 4 (dacB) from Escherichia coli, both in the native form and covalently linked to various antibiotics. Biochem., 45(3), 783-792.doi:10.1021/bi051533t
- Pratama, M. R. F., Poerwono, H., & Siswodihardjo, S. (2020). Molecular Docking of Novel 5-O-benzoylpinostrobin Derivatives as SARS-CoV-2 Main Protease Inhibitors. Pharm. Sci., 26(Covid-19), S63-S77.doi:10.34172/PS.2020.57
- Pratama, M. R. F., Nasibova, T. A., Pratiwi, D., Kumar, P., & Garaev, E. A. (2020). Peganum harmala and its Alkaloids as Dopamine Receptor Antagonists: in Silico Study. Biointerface Res. Appl. Chem., 11(3):10301-16. doi:10.33263/BRIAC113.1030110316
- Ammar, Y. A., Ghorab, M. M., El‐Sharief, A. S., Mohamed, S. I. (2002). Naproxen in heterocyclic chemistry: Novel syntheses of triazoles, triazolothiadiazines, triazolothiadiazoles, and triazolothiadiazepine bearing an asymmetric carbon atom and radiostability of the biologically active compounds. Heteroat. Chem., 13(3), 199-206. doi:1002/hc.10019
- Pomarnacka, E., Gdaniec, M. (2003). Synthesis and anticancer activity of 2-amino-8-chloro-5, 5-dioxo [1,2,4] triazolo [2, 3-b][1, 4, 2] benzodithiazine derivatives. Bioorganic & medicinal chemistry, 11(7), 1259-1267. doi:1016/s0968-0896(02)00638-7
- Saad, H. (1996). Synthesis of some pyridyloxymethyl-oxadiazoles, thiadiazoles and triazoles of expected pharmalogical activity. Indian j. chem., Sect. B: Organic chemistry, including medical chemistry, 35(9), 980-984.
- Thomas, K. D., Adhikari, A. V., Shetty, N. S. (2010). Design, synthesis and antimicrobial activities of some new quinoline derivatives carrying 1, 2, 3-triazole moiety. Eur. j. med. chem., 45(9), 3803-3810. doi: 1016/j.ejmech.2010.05.030
- Pantsar, T., Poso, A. (2018). Binding affinity via docking: fact and fiction. Molecules, 23(8), 1899.doi:10.3390/molecules23081899
- Lin, X., Li, X., Lin, X. (2020). A review on applications of computational methods in drug screening and design. Molecules, 25(6), 1375. doi:10.3390/molecules25061375
- Brogi, S., Ramalho, T. C., Medina-Franco, J. L., Kuca, K., Valko, M. (2020). In silico methods for drug design and discovery. Chem., 8:612. doi:10.3389/fchem.2020.00612
- Ekins, S., Mestres, J., Testa, B. (2007). In silico pharmacology for drug discovery: applications to targets and beyond. Br. J. Pharmacol., 152(1), 21-37. doi:10.1038/sj.bjp.0707306
- scheme1.png
Scheme 1. Synthesis of compounds 6a-f, 7a-g and 8a-e
- SISpectra.docx