Overall publication performance and dynamics
We first assessed the overall publication performance in neuroblastoma research during the last 38 years. In total, 12,435 documents, including 11,970 (96.2%) articles and 465 (9.8%) reviews, were published by 36,908 authors from 86 countries. The annual percentage growth rate indicating increasing annual scientific production was 11.8%. Linear fitting of the data revealed an increase in the number of publications written between 1980 and 2018 (r2 = 0.92 [CI: 0.86 to 0.96]; p < 0.0001]). Of 12,136 retrieved documents, a total of 316,017 received citations including self-citations and 289,357 were without self-citations. The average citation per document was 28.35 ± 7.7. There was a consistent citation dynamic ranging from 29.5 CPI in 1980 to 30.8 CPI in 2010. After 2011, the CPI was 12.7, which was lower compared to period the 1980–2010, because most newly published articles had not been cited much at the time of data extraction in our study. While the number of single-authored documents remains stable over the time (r2 = − 0.6, p = 0.24), the number of multi-authored documents increased significantly (r2 = 1.0, p = 0.003) (Fig. 1, Table S1). The overall collaboration index (CI) was 3.02. The majority of papers were published by authors in the United States (n = 3,202, 25.7%), Japan (n = 1,222, 9.8%), Italy (n = 1,129, 9.1%), Germany (n = 824, 6.6%), China (n = 741, 5.9%), the United Kingdom (n = 688, 5.5%) and France (n = 538, 4.3%). Among 1,828 journals represented in our dataset, the five most productive were Journal of Neurochemistry (n = 319, 17.4%), Cancer Research (n = 295, 16.1%), Journal of Pediatric Surgery (n = 278, 15.2%), Pediatric Blood and Cancer (n = 261, 14.3%), and Medical and Pediatric Oncology (n = 225, 12.3%).
Profiling of authors
In the entire dataset of 36,908 authors, 25,873 authors (70.1%) published a single paper related to neuroblastoma and were considered “occasional” authors; 5,178 (14.0%) published two papers; 2,076 (5.6%) published three papers; 3,781 (10.2%) published four or more papers. Authors who published more than one paper were considered to be “core” authors. The Lotka’s law estimation yielded a beta coefficient (β) of 2.3 and a constant coefficient (c) of 0.32 (r2 = 0.92). The Kolmogorov-Smirnov goodness-of-fit test found Lotka´s law estimation to be insignificantly different from the theoretically predicted inverse square function (p = 0.89). Additionally, the distribution of the number of publications per author had a hyperbolic aspect, according to Lotka’s law. This indicates that the author´s number of publications can be theoretically predicted and the research field of NB corresponds with the expected number of highly productive authors in the dataset according to Lotka´s law. Of the top 10 contributing authors, Berthold F was ranked first in the number of published articles (n = 169), Matthay KK had the highest h- and m-indices (63 and 2.2, respectively) while Seeger RC had the highest average citation per item count (100.2) (Table 1). Scientific productivity of the top authors on neuroblastoma research over time is presented in Figure S1.
Table 1
Top 10 contributing authors in field of neuroblastoma research
| Source | IF | NP | TC | h-index | g-index | m-index |
| Journal of Neurochemistry | 4.87 | 319 | 10221 | 53 | 71 | 1.39 |
| Cancer Research | 9.13 | 295 | 19170 | 80 | 117 | 2.35 |
| Journal of Pediatric Surgery | 2.09 | 278 | 4409 | 33 | 45 | 0.86 |
| Pediatric Blood and Cancer | 2.64 | 261 | 3368 | 27 | 40 | 1.68 |
| Oncogene | 6.85 | 194 | 9223 | 55 | 82 | 1.83 |
| PLOS One | 2.77 | 193 | 3528 | 27 | 43 | 2.07 |
| Neuroscience Letters | 2.15 | 192 | 3568 | 31 | 45 | 0.86 |
| Journal of Clinical Oncology | 26.3 | 180 | 16426 | 75 | 121 | 2.20 |
| European Journal of Cancer | 7.19 | 178 | 5229 | 40 | 57 | 1.37 |
| International Journal of Cancer | 7.3 | 172 | 5123 | 35 | 74 | 1.22 |
The network analysis revealed six clusters of authors (n1 = 10, n2 = 10, n3 = 6, n4 = 4, n5 = 4, n6 = 3). (Fig. 2, Table S2). To examine collective performance, the total number of publications, mean h-indices, and average citations per item of the authors in each cluster were calculated using only articles in the dataset across all years. A Kruskal-Wallis test found significant differences between clusters according to h-indices (p = 0.02, post hoc Mann Whitney test: cluster 2 vs cluster 1, p = 0.001) and average citations per item (p = 0.001, post-hoc Mann Whitney test: cluster 2 vs cluster 1, p < 0.0001; cluster 2 vs cluster 5, p = 0.008) with dominance of cluster 2. There were no differences in total number of publications between the clusters. The CI for each group was calculated (CI1 = 2.56; CI2 = 3.02; CI3 = 2.67; CI4 = 1.98; CI5 = 2.12; CI6 = 1.97), indicating that group 2 was the most internally collaborative in the dataset.
Source landscapes
In the time frame analyzed, there were 1,828 academic journals publishing papers related to neuroblastoma research. Journal of Neurochemistry (impact factor [IF] 2018 = 4.87) had the highest publication output (n = 319, 17.4%), followed by Cancer Research (IF 2018 = 8.37; n = 295, 16.1%), Journal of Pediatric Surgery (IF 2018 = 2.09; n = 278, 15.2%), and Pediatric Blood and Cancer (IF 2018 = 2.64; n = 261, 14.3%). The most cited journals were Cancer Research (19,170 citations), Journal of Biological Chemistry (16,699 citations), Journal of Clinical Oncology (14,403 articles), Proceedings of the National Academy of Sciences of the United States of America (12,602 articles), and Nature (11,440 articles). Table 2 summarized source impact of the top 10 journals publishing on neuroblastoma.
Table 2
Source impact of the top 10 journals publishing on neuroblastoma
| Region | TP | h-index | CAC | SCP | MCP (%) | TC | AAC |
| USA | 4328 | 141 | 3202 | 2284 | 918 (21.2) | 113525 | 35.45 |
| Japan | 1364 | 76 | 1222 | 1031 | 191 (14.0) | 23268 | 24.66 |
| Italy | 1336 | 78 | 1129 | 864 | 265 (19.8) | 26134 | 27.85 |
| Germany | 1128 | 85 | 824 | 580 | 244 (21.6) | 21597 | 31.19 |
| UK | 910 | 75 | 688 | 467 | 221 (24.3) | 18424 | 26.78 |
| China | 829 | 44 | 741 | 633 | 108 (13.0) | 9144 | 32.61 |
| France | 748 | 70 | 538 | 371 | 167 (22.3) | 14846 | 33.24 |
| Sweden | 454 | 56 | 355 | 219 | 136 (30.0) | 10149 | 33.16 |
| Spain | 454 | 55 | 344 | 256 | 88 (19.4) | 7610 | 30.00 |
| Canada | 427 | 52 | 289 | 199 | 90 (21.0) | 7468 | 27.21 |
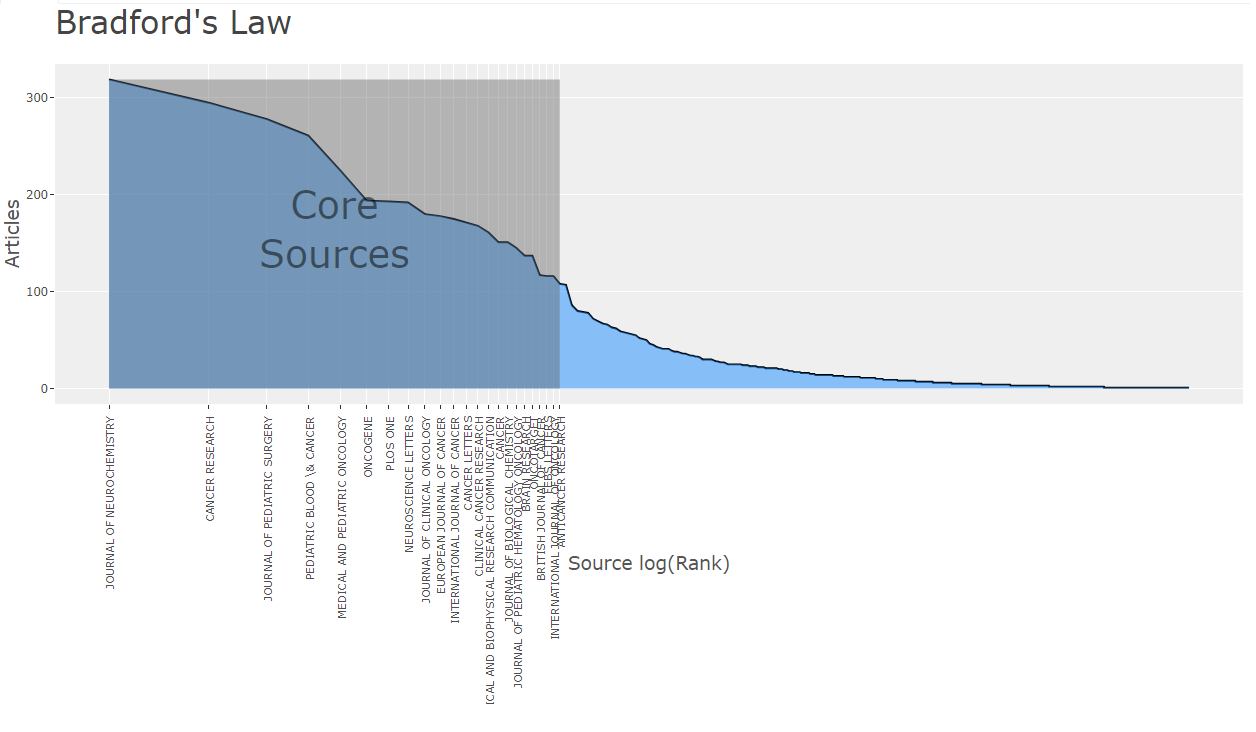
Source clustering through Bradford´s law revealed that 23 (1.2%) journals published 4,168 (33.5%) of the articles on neuroblastoma as represented by the first zone (Figure S2). The middle zone, comprised of 157 (8.6%) journals, published 4,164 (33.4%) of the articles; the minor zone consists of 1,648 (90.2%) journals with 4,103 (33.1%) papers.
Active countries and international collaborations
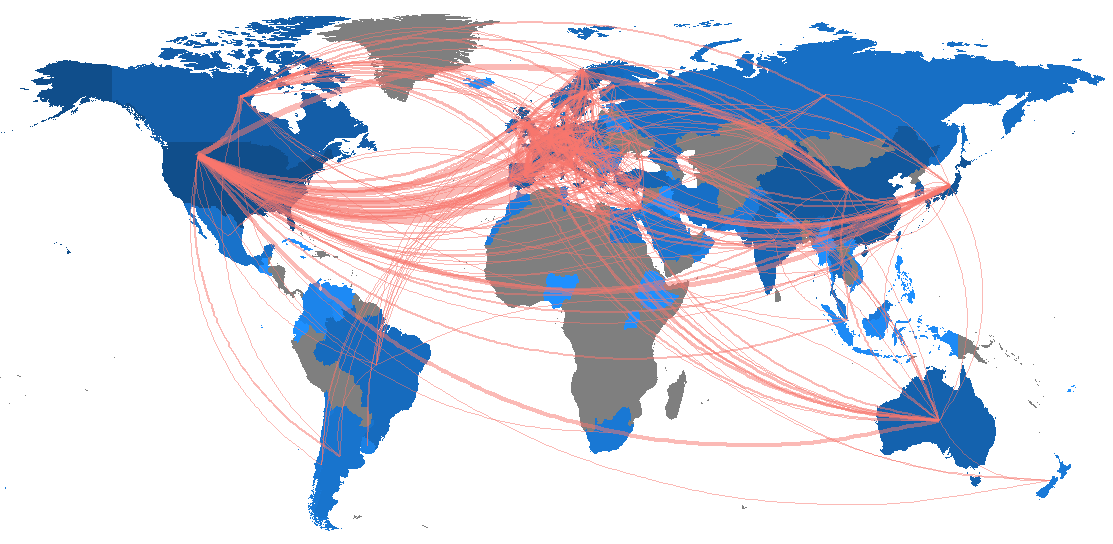
Eighty-six countries were involved in neuroblastoma total research output. Among them, 9,332 (75%) of publications were contributed by the top ten most productive countries (Table 3). The United States of America (USA) published the most papers (n = 4,328), had the highest h-index (141) and ranked first in terms of single country publications (n = 2,284). Researchers from the USA showed the highest collaboration performance with total link strength (TLS) of 1438, followed by Germany (TLS = 852), the United Kingdom (TLS = 829), Italy (TLS = 801), and France (TLS = 707). International collaboration (MCP) analysis showed that 136 articles (30.0%) produced by Sweden had international authors, followed by authors from the UK (n = 221, 24.3%), France (n = 167, 22.3%), Germany (n = 244, 21.6%), and the USA (n = 918, 21.2%).
|
Region
|
TP
|
h-index
|
CAC
|
SCP
|
MCP (%)
|
TC
|
AAC
|
|
USA
|
4328
|
141
|
3202
|
2284
|
918 (21.2)
|
113525
|
35.45
|
|
Japan
|
1364
|
76
|
1222
|
1031
|
191 (14.0)
|
23268
|
24.66
|
|
Italy
|
1336
|
78
|
1129
|
864
|
265 (19.8)
|
26134
|
27.85
|
|
Germany
|
1128
|
85
|
824
|
580
|
244 (21.6)
|
21597
|
31.19
|
|
UK
|
910
|
75
|
688
|
467
|
221 (24.3)
|
18424
|
26.78
|
|
China
|
829
|
44
|
741
|
633
|
108 (13.0)
|
9144
|
32.61
|
|
France
|
748
|
70
|
538
|
371
|
167 (22.3)
|
14846
|
33.24
|
|
Sweden
|
454
|
56
|
355
|
219
|
136 (30.0)
|
10149
|
33.16
|
|
Spain
|
454
|
55
|
344
|
256
|
88 (19.4)
|
7610
|
30.00
|
|
Canada
|
427
|
52
|
289
|
199
|
90 (21.0)
|
7468
|
27.21
|
TP: total production; CAC: corresponding author´s country; SCP: single country publication; MCP: multiple countries publications; TC: total citations; AAC: average article citations
Table 3
Most productive countries contributing to neuroblastoma research
The international collaboration network is presented in Figure S3. The number of links between any two countries represents the strength of collaboration, while the color intensity is proportional to the number of publications. The strongest collaboration was between the USA and Germany (frequency, n=160), the USA and Italy (n=156), the USA and the UK (n=137), and the UK and Italy (n=131).
Most cited NB papers and NB papers without a single citation
Of 12,435 publications related to NB, 12,136 (94.8%) were cited at least one time and 299 (2.4%) publications remain uncited after their publication. Table 4 demonstrates the top 10 studies according to total number of citations. The review article entitled “Revisions of the international criteria for neuroblastoma diagnosis, staging, and response to treatment” published by Broder GM in Journal of Clinical Oncology in 1993 received the highest number of citations (n=1,450).
|
Author, year
|
Article
|
Journal
|
TC
|
TC per year
|
|
Broder GM, 1993 (29)
|
Revisions of the international criteria for neuroblastoma diagnosis, staging, and response to treatment.
|
J Clin Oncol
|
1,450
|
55.7
|
|
Kaghad M, 1997 (30)
|
Monoallelically expressed gene related to p53 at 1p36, a region frequently deleted in neuroblastoma and other human cancers
|
Cell
|
1,403
|
63.7
|
|
Broder GM, 2003 (7)
|
Neuroblastoma: Biological insights into a clinical enigma
|
Nat Rec Cancer
|
1,328
|
83.0
|
|
Matthay KK, 1999 (31)
|
Treatment of high-risk neuroblastoma with intensive chemotherapy, radiotherapy, autologous bone marrow transplantation, and 13-cis-retinoic acid
|
N Engl J Med
|
1,246
|
62.3
|
|
Maris JM, 2010 (32)
|
Neuroblastoma
|
Lancet
|
1,153
|
96.1
|
|
Maris JM, 2010 (3)
|
Recent Advances in Neuroblastoma
|
N Engl J Med
|
792
|
88.0
|
|
Yu A, 2010 (33)
|
Anti-GD2 Antibody with GM-CSF, Interleukin-2, and Isotretinoin for Neuroblastoma
|
N Engl J Med
|
707
|
78.5
|
|
Mosse YP, 2008 (34)
|
Identification of ALK as a major familial neuroblastoma predisposition gene
|
Nature
|
704
|
64.0
|
|
Shimada H, 1984 (35)
|
Histopathologic prognostic factors in neuroblastic tumors: definition of subtypes of ganglioneuroblastoma and an age-linked classification of neuroblastomas
|
J Natl Cancer Inst
|
686
|
19.6
|
|
Pule M, 2008 (36)
|
Virus-specific T cells engineered to coexpress tumor-specific receptors: persistence and antitumor activity in individuals with neuroblastoma
|
Nat Med
|
674
|
61.3
|
Table 4
Most cited neuroblastoma papers
Keywords analysis
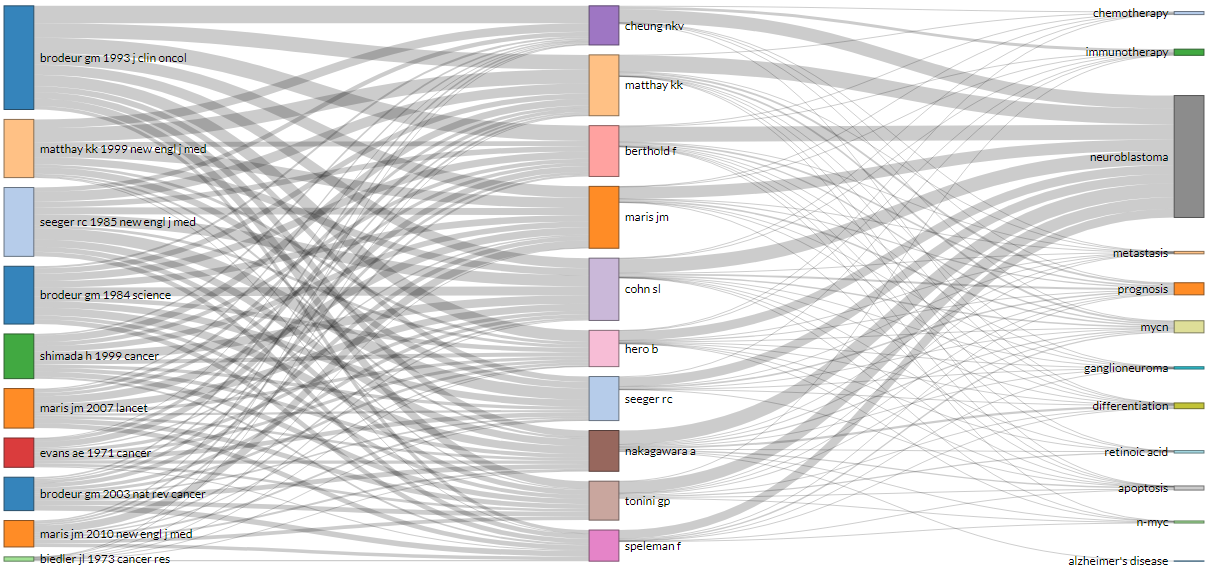
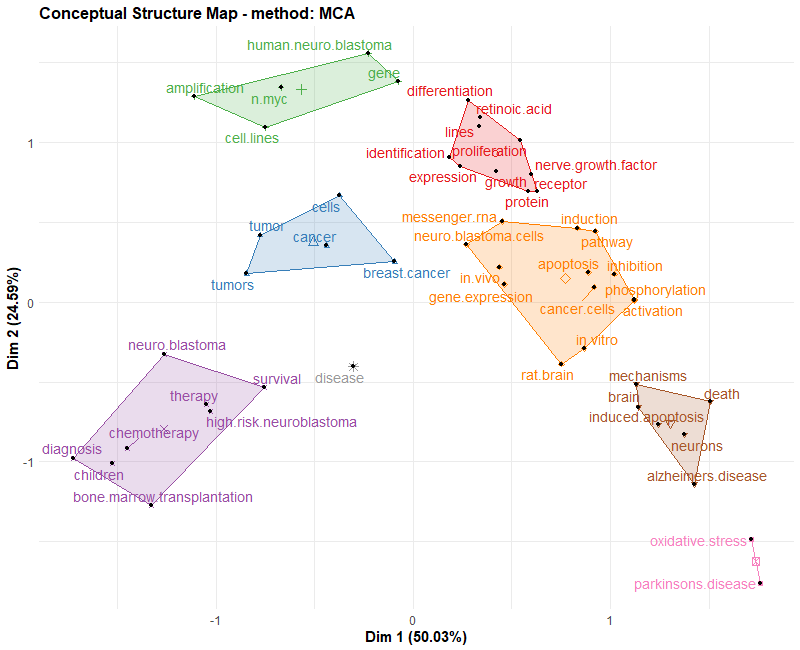
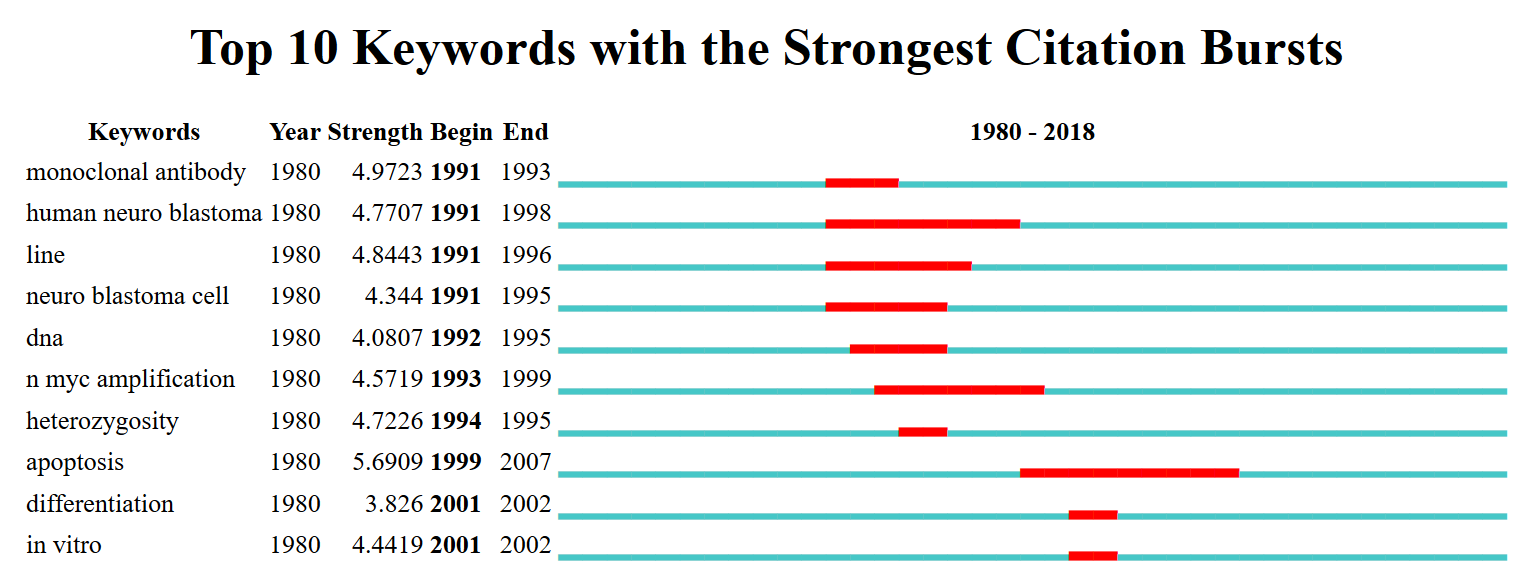
The most frequent author´s keywords were “neuroblastoma” (n=4505), “apoptosis” (n=821), “differentiation” (n=371), “mycn” (n=262), “ganglioneuroma” (n=222), “oxidative stress” (n=218), “neuroblastoma cells” (n=214), “retinoic acid” (n=195), “chemotherapy” (n=153), “SH-SY5Y” (n=153). The overall keyword network visualization is presented in Figure 3. We identified keywords with a high-citation burst, which can be used to predict research areas attracting an extraordinary degree of attention from its scientific community (Figure S4). Next, we aimed to map the conceptual co-word structure using the word co-occurrences in our bibliographic metadata to identify clusters of documents which express common concepts. The results are plotted on a two-dimensional map (Figure S5). Overall, 7 clusters of words could be identified (each color represents a cluster of word). The three-fields plot shows the relationship between the author´s keywords (research contents, right field), references authors use (intelectual roots, left field), and the top authors (middle field) (Figure S6).