3.1 Characterization of SiO2 NPs
The wide application of SiO2 NPs in the biomedical field has raised concerns regarding the safety of these NPs in humans and the environment. While the cytotoxicity of SiO2 NPs has been investigated by numerous scientists [3, 5, 35], most of these studies explored various SiO2 NP characteristics using a wide variety of in vitro models. Until now, no study has evaluated the retinal toxicity either in vitro or in vivo. In the present study, we explored the retinal toxicity of two types of SiO2 NPs with different sizes both in vitro and in vivo. We also investigated the potential mechanism underlying the retinal toxicity induced by SiO2 NPs.
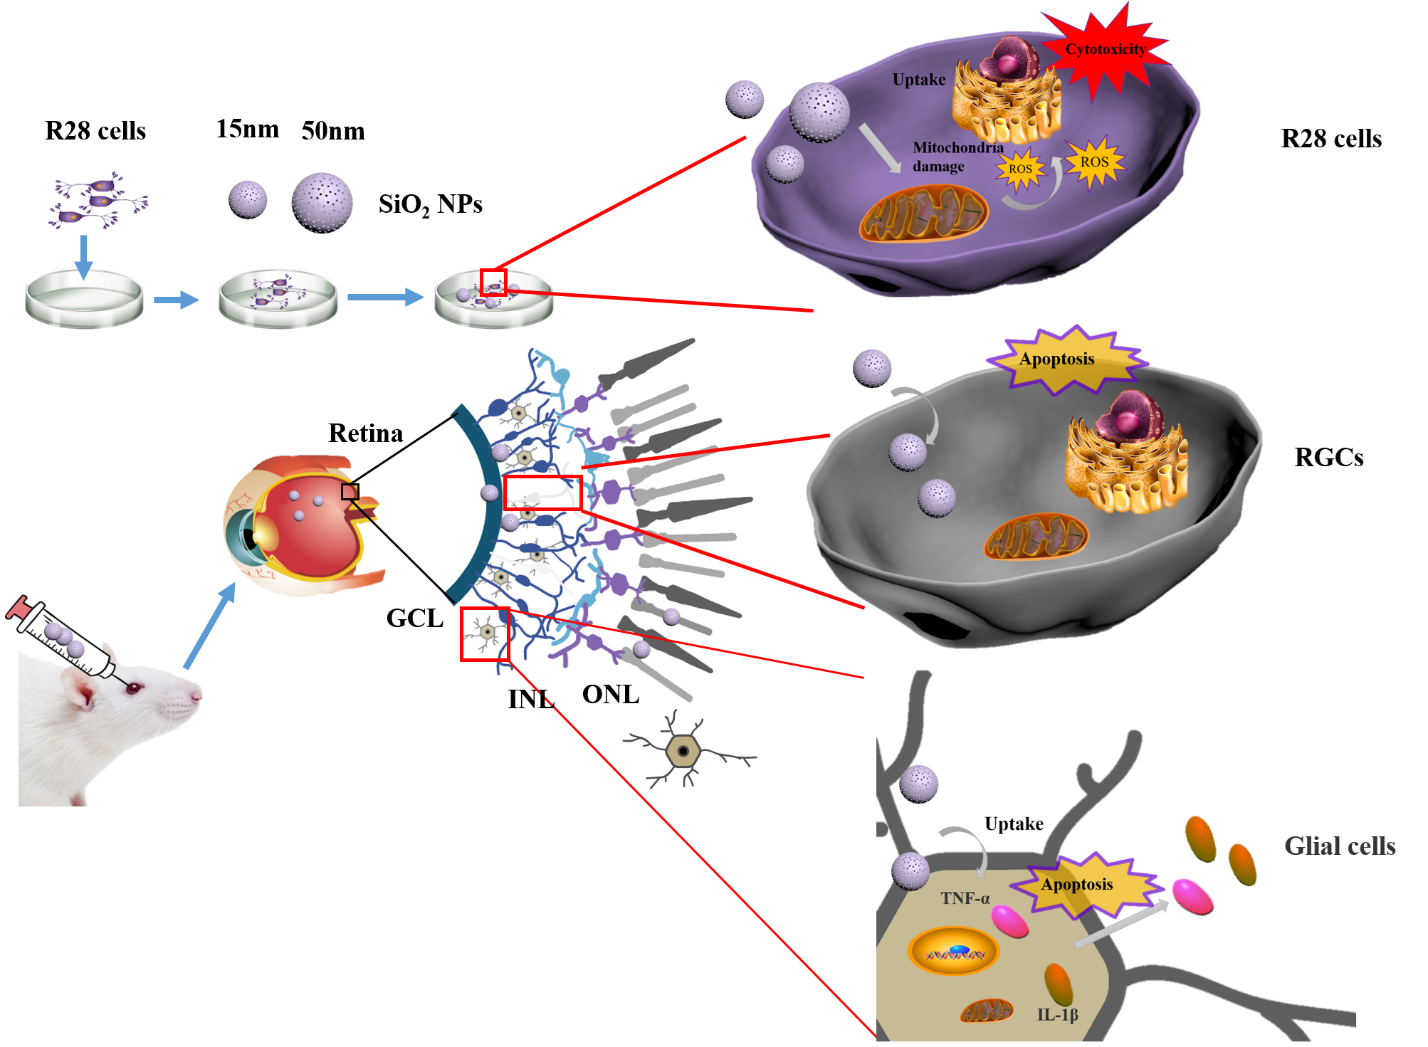
Recently, SiO2 NPs have shown great potential in the treatment of ocular diseases [36–39]. Given the widespread use of SiO2 NPs to treat ocular diseases, the ocular toxicity of SiO2 NPs requires more attention from scientists and ophthalmologists. Park et al. reported that SiO2 NPs with sizes of 50, 100, and 150 nm did not induce significant cytotoxicity in cultured human corneal epithelial cells [40]. However, Chen et al. reported that SiO2 NPs led to cytotoxicity, ROS generation, and DNA damage in the human cornea [15]. SiO2 NPs can be used as intravitreal drug carriers [38, 41]; however, to the best of our knowledge, the retinal toxicity of SiO2 NPs has not been investigated before now. Therefore, we conducted both in vitro and in vivo experiments to evaluate the retinal toxicity of SiO2 NPs with sizes of 15 and 50 nm. The in vitro study used human R28 retinal precursor cells, which are expected to mimic in vivo responses.
We first evaluated the effect of SiO2 NP size on retinal toxicity. The morphology, size, and structure the of SiO2 NPs were characterized by SEM, TEM, and XRD, respectively. The SEM images of the two types of SiO2 NPs (Figs. 1A & B) indicate that both NPs had spherical morphologies. The TEM images (insets of Figs. 1A & B) show that the SiO2 NPs had sizes of approximately 15 and 50 nm and were slightly aggregated in aqueous solution. Based on the XRD spectra (Figs. 1C & D), both types of SiO2 NPs were amorphous.
3.2 Cytotoxicity of SiO2 NPs in R28 cells
We compared the cytotoxicity of the SiO2 NPs with different sizes (15 and 50 nm) in human R28 retinal precursor cells. Cytotoxicity was determined by adenosine triphosphate (ATP) assay and lactate dehydrogenase (LDH) release assay. (Fig. 2). The R28 cells were treated with the two types of SiO2 NPs at various concentrations ranging from 5–80 µg/mL for 12 and 24 h. As shown in Fig. 2, the SiO2 NPs induced significant time- and concentration-dependent decreases in ATP content (Figs. 2A & B) and LDH release (Fig. 2C & D). Among the two types of SiO2 NPs, the R28 cells showed greater sensitivity to the 15-nm SiO2 NPs.
3.3 SiO2 NPs induce morphological changes in R28 cells
The morphology of the R28 cells changed as the SiO2 NP concentration increased. After 12 h, the cell morphology became irregular when the NP concentration reached 20 (50-nm SiO2 NPs; Fig. 3A) or 40 µg/mL (50-nm SiO2 NPs; Fig. 3A). At 24 h, the changes in cell morphology became more prominent with increasing SiO2 NP concentration (Fig. 3B) At the concentration of 80 µg/mL, most cells were detached, and the density was obviously reduced.
3.4 In vitro localization of SiO2 NPs in R28 cells
The in vitro distributions of SiO2 NPs with sizes of 15 and 50 nm in R28 cells were evaluated by TEM. In R28 cells before SiO2 NP treatment, no SiO2 NPs were observed in the nucleus or cytosol (Fig. 4). After exposure for 24 h, both 15- and 50-nm SiO2 NPs were visible in the cytoplasm, and some 15-nm SiO2 NPs were found in the mitochondria.
3.5 SiO2 NPs induce mitochondrial dysfunction
As the 15-nm SiO2 NPs accumulated in the mitochondria, we measured the change in mitochondrial depolarization (ΔΨm) in R28 cells treated with 15-nm SiO2 NPs. The value of ΔΨm was measured using JC-1 dye. The R28 cells were treated with SiO2 NPs at concentrations of 20, 40, and 80 µg/mL for 6, 12, and 24 h. Decreases in mitochondrial depolarization in the R28 cells were observed as early as 6 h after treatment with 80 µg/mL SiO2 NPs (Fig. 5A). As shown by the JC-1 staining images (Fig. 5C), the transition from red fluorescence to green fluorescence became more obvious at 24 h after treatment, suggesting that the SiO2 NPs induced a significant time- and concentration-dependent decrease in mitochondrial depolarization (Fig. 5). Consequently, in subsequent experiments, the SiO2 NP concentration of 80 µg/mL was used to investigate the retinal toxicity in vivo.
3.6 SiO2 NPs induce retinal toxicity in vivo
To examine the retinal toxicity of SiO2 NPs in vivo, SiO2 NPs were intravitreally injected. At 1, 7, and 14 d after injection, the rats were euthanized, and frozen sections of the retina were prepared for fluorescence staining. The retina shape became irregular at 7 d after injection, and the retinas became very loose at 14 d after injection. Notably, many cells infiltrated into the retinal ganglion cell layer (GCL); these cells were suspected to be inflammatory cells. To measure retinal cell death after SiO2 NP injection, cells stained with DAPI were counted in the outer nuclear layer (ONL), inner nuclear layer (INL), and GCL. The number of cells decreased with time after injection in the ONL, INL, and GCL, and the overall number of cells also decreased (Fig. 6). Next, retinal cryosections were analyzed by TUNEL apoptosis assay (Fig. 7). The percentage of apoptotic cells increased in the SiO2 NP-treated groups in a time-dependent manner. Compared to the sham group, the intravitreal injection of SiO2 NPs increased the number of TUNEL-positive cells by approximately 4-, 16-, and 32-fold after 1, 7, and 14 d, respectively.
3.7 SiO2 NPs activate the inflammatory response in vivo
As mentioned above, cells that we suspected to be inflammatory cells infiltrated the GCL. Thus, we investigated whether the SiO2 NPs caused retinal inflammation. GFAP, a marker of glial cells in the retina, was assessed by immunofluorescence staining. As demonstrated in Fig. 8, glial cells were obviously activated as early as 1 d after the injection of SiO2 NPs, and the number of activated glial cells rose sharply at 7 d after injection (Figs. 8A & B). The maximum GFAP signal induction was approximately 60 times that of the PBS control at 14 d after injection (Fig. 8C). RGCs can be damaged by various stimuli such as inflammation, ischemia, oxidative stress, and excitotoxicity [42]. Therefore, to understand whether the activation of glial cells can damage RGCs, we evaluated the expression of β-III-tubulin, a marker of RGCs. As shown in Fig. 8A, at 1 d after SiO2 NP injection, the RGCs (β-III-tubulin positive) were reduced by 52% compared to the vehicle control. The cell number decreased more predominately at 7 and 14 d after injection (Figs. 8B & C). These findings demonstrate that the intravitreal injection of SiO2 NPs activated glial cells and damaged RGCs.
As SiO2 NPshave been demonstrated to induce inflammation in HUVEC cells [1], and pro-inflammatory cytokines (e.g., TNF-α and IL-1β) secreted by macrophages play a crucial role in the inflammation process, we investigated whether the SiO2 NPs induced the secretion of TNF-α and IL-1β. The retinas were stained with antibodies against TNF-α and IL-1β and assessed by immunofluorescence staining. The levels of TNF-αand IL-1β were notably increased in the group injected with SiO2 NPs compared to the control. For example, the number ofIL-1β-positive cells increased by 8- and 23-fold compared to the vehicle control at 1 and 7 d after SiO2 NP injection, respectively (Figs.9A & B); the number of TNF-α-positive cells showed similar trends (Figs.9C & D).
Taken together, the above results indicate that the SiO2 NPs caused retinal cell death and activated retinal inflammation.
3.8 SiO2 NPs cause ROS overproduction
Driven by the in vitro and in vivo effects of SiO2 NPs on cell viability, morphology, mitochondrial dysfunction, apoptosis, and inflammation, we investigated the potential mechanisms underlying the retinal toxicity of SiO2 NPs. Previous studies demonstrated that one of the main toxicity mechanisms of NPs involves ROS generation [15, 23, 43]. Therefore, we first investigated whether the 15-and 50-nm SiO2 NPs induced oxidative stress. R28 cells were treated with SiO2 NPs at concentrations ranging from 5 to 80 µg/mL, and ROS production was monitored at 2, 4, 6, 12, and 24 h after treatment (Fig. 10). The SiO2 NPs were found to have size-, time-, and concentration-dependent effects on ROS generation. Compared with the control group, the ROS levels increased significantly within 2 h of treatment with 15-nm SiO2 NPs at 80 µg/ml. The ROS level continued to increase dramatically over time, reaching a maximum value (approximately 3 times that of the control group) at 6 h after treatment with 15-nm SiO2 NPs (Fig. 10A). Similarly, the ROS level increased significantly at 4 h after treatment with 50-nm SiO2 NPs (80 µg/mL); the maximum ROS level (2.3 times that of the control) occurred at 6 h after treatment (Fig. 10C). The ROS levels then decreased from 6 h to 12 and 24 h after treatment, presumably due to reduced cell growth (Fig. 2). To further verify the ROS generation results, we performed ROS ଂuorescence staining. R28 cells were treated with 15- and 50-nm SiO2 NPs at concentrations of 20 and 80 µg/mL. The CLSM images show that the ROS levels increased with incubation time (Figs. 10B & D). The increase in ROS level suggests that treatment with SiO2 NPs resulted in oxidative stress. Subsequent assays focused on the 15-nm SiO2 NPs.
3.9 SiO2 NP-induced retinal toxicity is attenuated by ROS scavenging
To further investigate the role of ROS generation in the retinal toxicity of SiO2 NPs, we used NAC, a ROS scavenger, to inhibit intracellular ROS generation. R28 cells were pretreated with NAC (10 mmol) for 1 h prior to treatment with SiO2 NPs (5–80 µg/ml) for 12 h. As shown in Fig. 11A, NAC significantly attenuated ROS induction. To further verify this result, we performed ROS ଂuorescence staining. The CLSM images show that pretreating cells with NAC before treatment with 40 µg/mL SiO2 NPs inhibited ROS production (Fig. 11B). Finally, the pretreatment of cells with NAC significantly decreased SiO2 NP-induced retinal toxicity in the R28 cells, as evidenced by the reduction in ATP content (Fig. 11C). These findings indicate that SiO2 NP-induced retinal toxicity was partially mediated by ROS generation.