Participants
The study in question was a randomized, double-blind study involving 14 Polish adult sub-elite soccer players (23.1 ± 2.1 years, 179.6 ± 8.5 cm, 74.1 ± 8.5 kg) from different teams. Anyone could participate in this study twice. A total of 23 trials were performed, of which 9 people took 400 mg of caffeine and 8 people took 120 mg of genistein. The placebo group (400 mg vitamin C) consisted of 6 men. Criteria for inclusion in the study:
- male gender,
- age ranging from 18 to 30 years,
- physically active soccer players,
- low or optimal level of adipose tissue for health (5 - 22% [18]).
Certain anthropometric features of the studied participants increased the homogeneity of the group. The characteristics of the group are presented in Table 1.
Study design
The study was conducted at the Department of Human Nutrition, Faculty of Biotechnology and Food Sciences at the University of Life Sciences in Wrocław. At each stage, the test was carried out in a sterile, closed room and in accordance with Good Hygiene Practice. Participants were informed about the purpose of the research and the possibility of opting out of the experiment at any stage. Consent to participate in the clinical trial was declared by a handwritten signature on the declaration. Laboratory tests were carried out in the period from May 14 to June 6, 2019.
Procedures
The study started after receiving the approval of the Bioethics Committee at the Medical University of Piastów Śląskich in Wrocław - 239/2019 of March 18, 2019.
Anthropometric measurements
The men were informed about the necessity to come on an empty stomach. Using the Accuniq BC380 analyzer, basic anthropometric measures and body composition were determined, including : Total Fat Mass (PB), Viscellular Fat Area (VFA), Muscle Mass (SSM), Total Body Water (TBW).
24-hour dietary interview
On the day of the measurements, the participants were interviewed regarding food consumption in the last 24 hours. The analysis of 24-hour nutritional interviews took into account: energy value, protein content, carbohydrates, total fat, monounsaturated fatty acids, saturated fatty acids, polyunsaturated fatty acids, dietary fiber, vitamins B1, B2, B6, magnesium and calcium.
Consumption of a standardized milk meal
Studies [19–21] have shown that saturated fatty acids (SFA) have different effects on postprandial lipemia compared to monounsaturated fatty acids (MUFA) and polyunsaturated fatty acids (PUFA). The effect of increasing the concentration of triglycerides in the blood is influenced not only by the amount and type of dietary fat, but also by other dietary components, such as: fiber, glucose, starch and alcohol [22–24]. A standardized milk meal was prepared for the participants (based on the data from the literature) [19–21,23,24]. After initial measurements, the examined participants consumed a dairy product - 70 ml of cream, 18% UHT. It did not contain fiber, protein, carbohydrates or other ingredients, so that the effect was noticeable as soon as possible. The increase in fatty acid concentration after consuming the test meal was supposed to take place in a short time. Before eating meals, the concentration of glucose and triglycerides in the capillary blood of the athletes was measured.
The CardioChek PA device was used to test blood triglyceride concentrations. An Accu-Chek Active glucometer was used to measure glucose concentrations. Thereafter, the concentration of these two biochemical markers was monitored every 15 minutes. The participant was qualified to the next stage, compound consumption, if the athlete had been observed to have had, respectively, an increase and a decrease in triglyceride concentration. If the triglyceride concentration fluctuated, measurements were taken up to a maximum of 90 minutes.
Active Compound Ingestion
Study participants consumed one compound: caffeine, genistein, or placebo. Due to the small differences in body weight, the men took the same dose of the active compounds. In the case of caffeine, it was 400 mg, and in the case of genistein, 120 mg. The placebo was vitamin C at a dose of 400 mg. The concentration of glucose and triglycerides in the capillary blood was measured every 15 minutes. The study scheme is presented in Fig. 1. The participant finished the study when an increase and a decrease in triglyceride concentration, respectively, had been observed. If no such reaction occurred, measurements were taken up to 105 minutes.
Analysis of results
In the created database, the exact values of the concentrations of selected blood chemistry indicators were included and the percentage increase in relation to the initial values was calculated. This made it possible to test the effectiveness of these compounds depending on their type and the time during which this effect is noticeable.
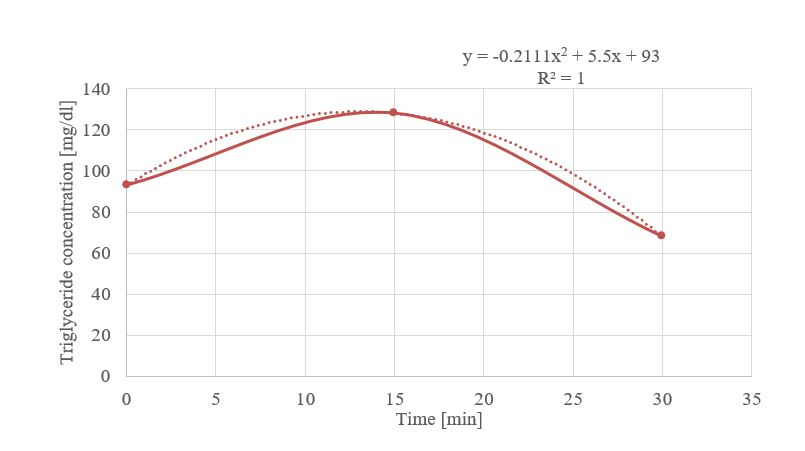
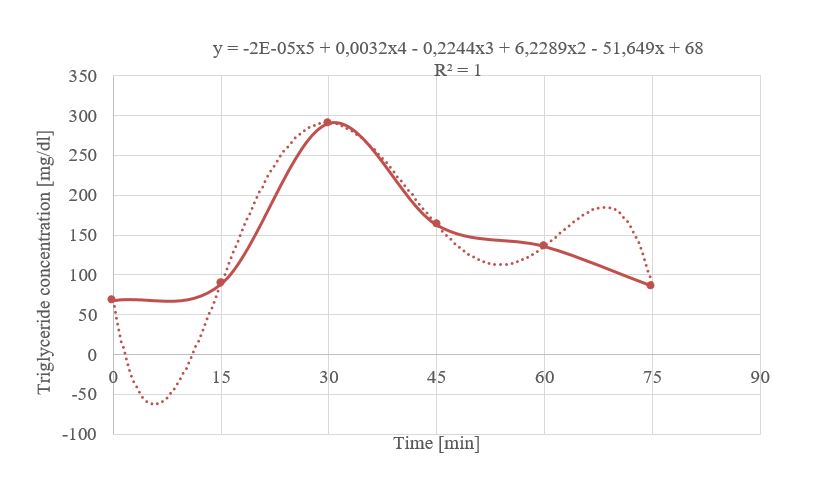
The rate of increase in triglyceride concentration is a physical quantity representing the change in triglyceride concentration per unit time [(mg / dL) / min]. The triglyceride concentrations of all participants after consuming the cream and the compound are presented in Tables 2 and 3 consecutively. The following scheme was followed for each participant (example based on data obtained for 1 participant):
- Two graphs of the change in triglyceride concentration over time after consuming the test meal and after administration of the active compound (Figures 1 and 2).
- A trend line was drawn and described with a polynomial so that the curve fitting coefficient R2 was close to 1. The more the polynomial plot fits the points marked on the coordinate system, the closer the R value is to 1.
- The tangent to the polynomial was determined at the point from which a rapid increase in triglyceride concentration was observed. A tangent is a geometric interpretation of the derivative of a polynomial function. In the graph, 1 tangent was assigned to the point x, equal to 0 min, and in the second graph to the point x, equal to 15 min.
- The rate of increase in triglyceride concentration was calculated. The rate of increase in triglyceride concentration was measured using the tan tangent, i.e., the angle of its inclination to the x axis.
Statistical analysis
The research results were collected in an Excel spreadsheet. The statistical analysis of the results was performed in Statistica 13.1 PL. In order to test the compliance of the data with the normal distribution, the Shapiro-Wilk test was used. The mean, standard deviation for parametric data, median and lower quartile (Q1) and upper quartile (Q3) for non-parametric data were calculated. In order to determine statistically significant differences between the variables, non-parametric Kruskal-Wallis and U Mann-Whitney tests were used. The significance level of α = 0.05 was adopted for both of these tests. The relationships between the variables were determined using the Spearman R correlation. The correlations were statistically significant at p ≤ 0.100.