Cell lines and cell culture
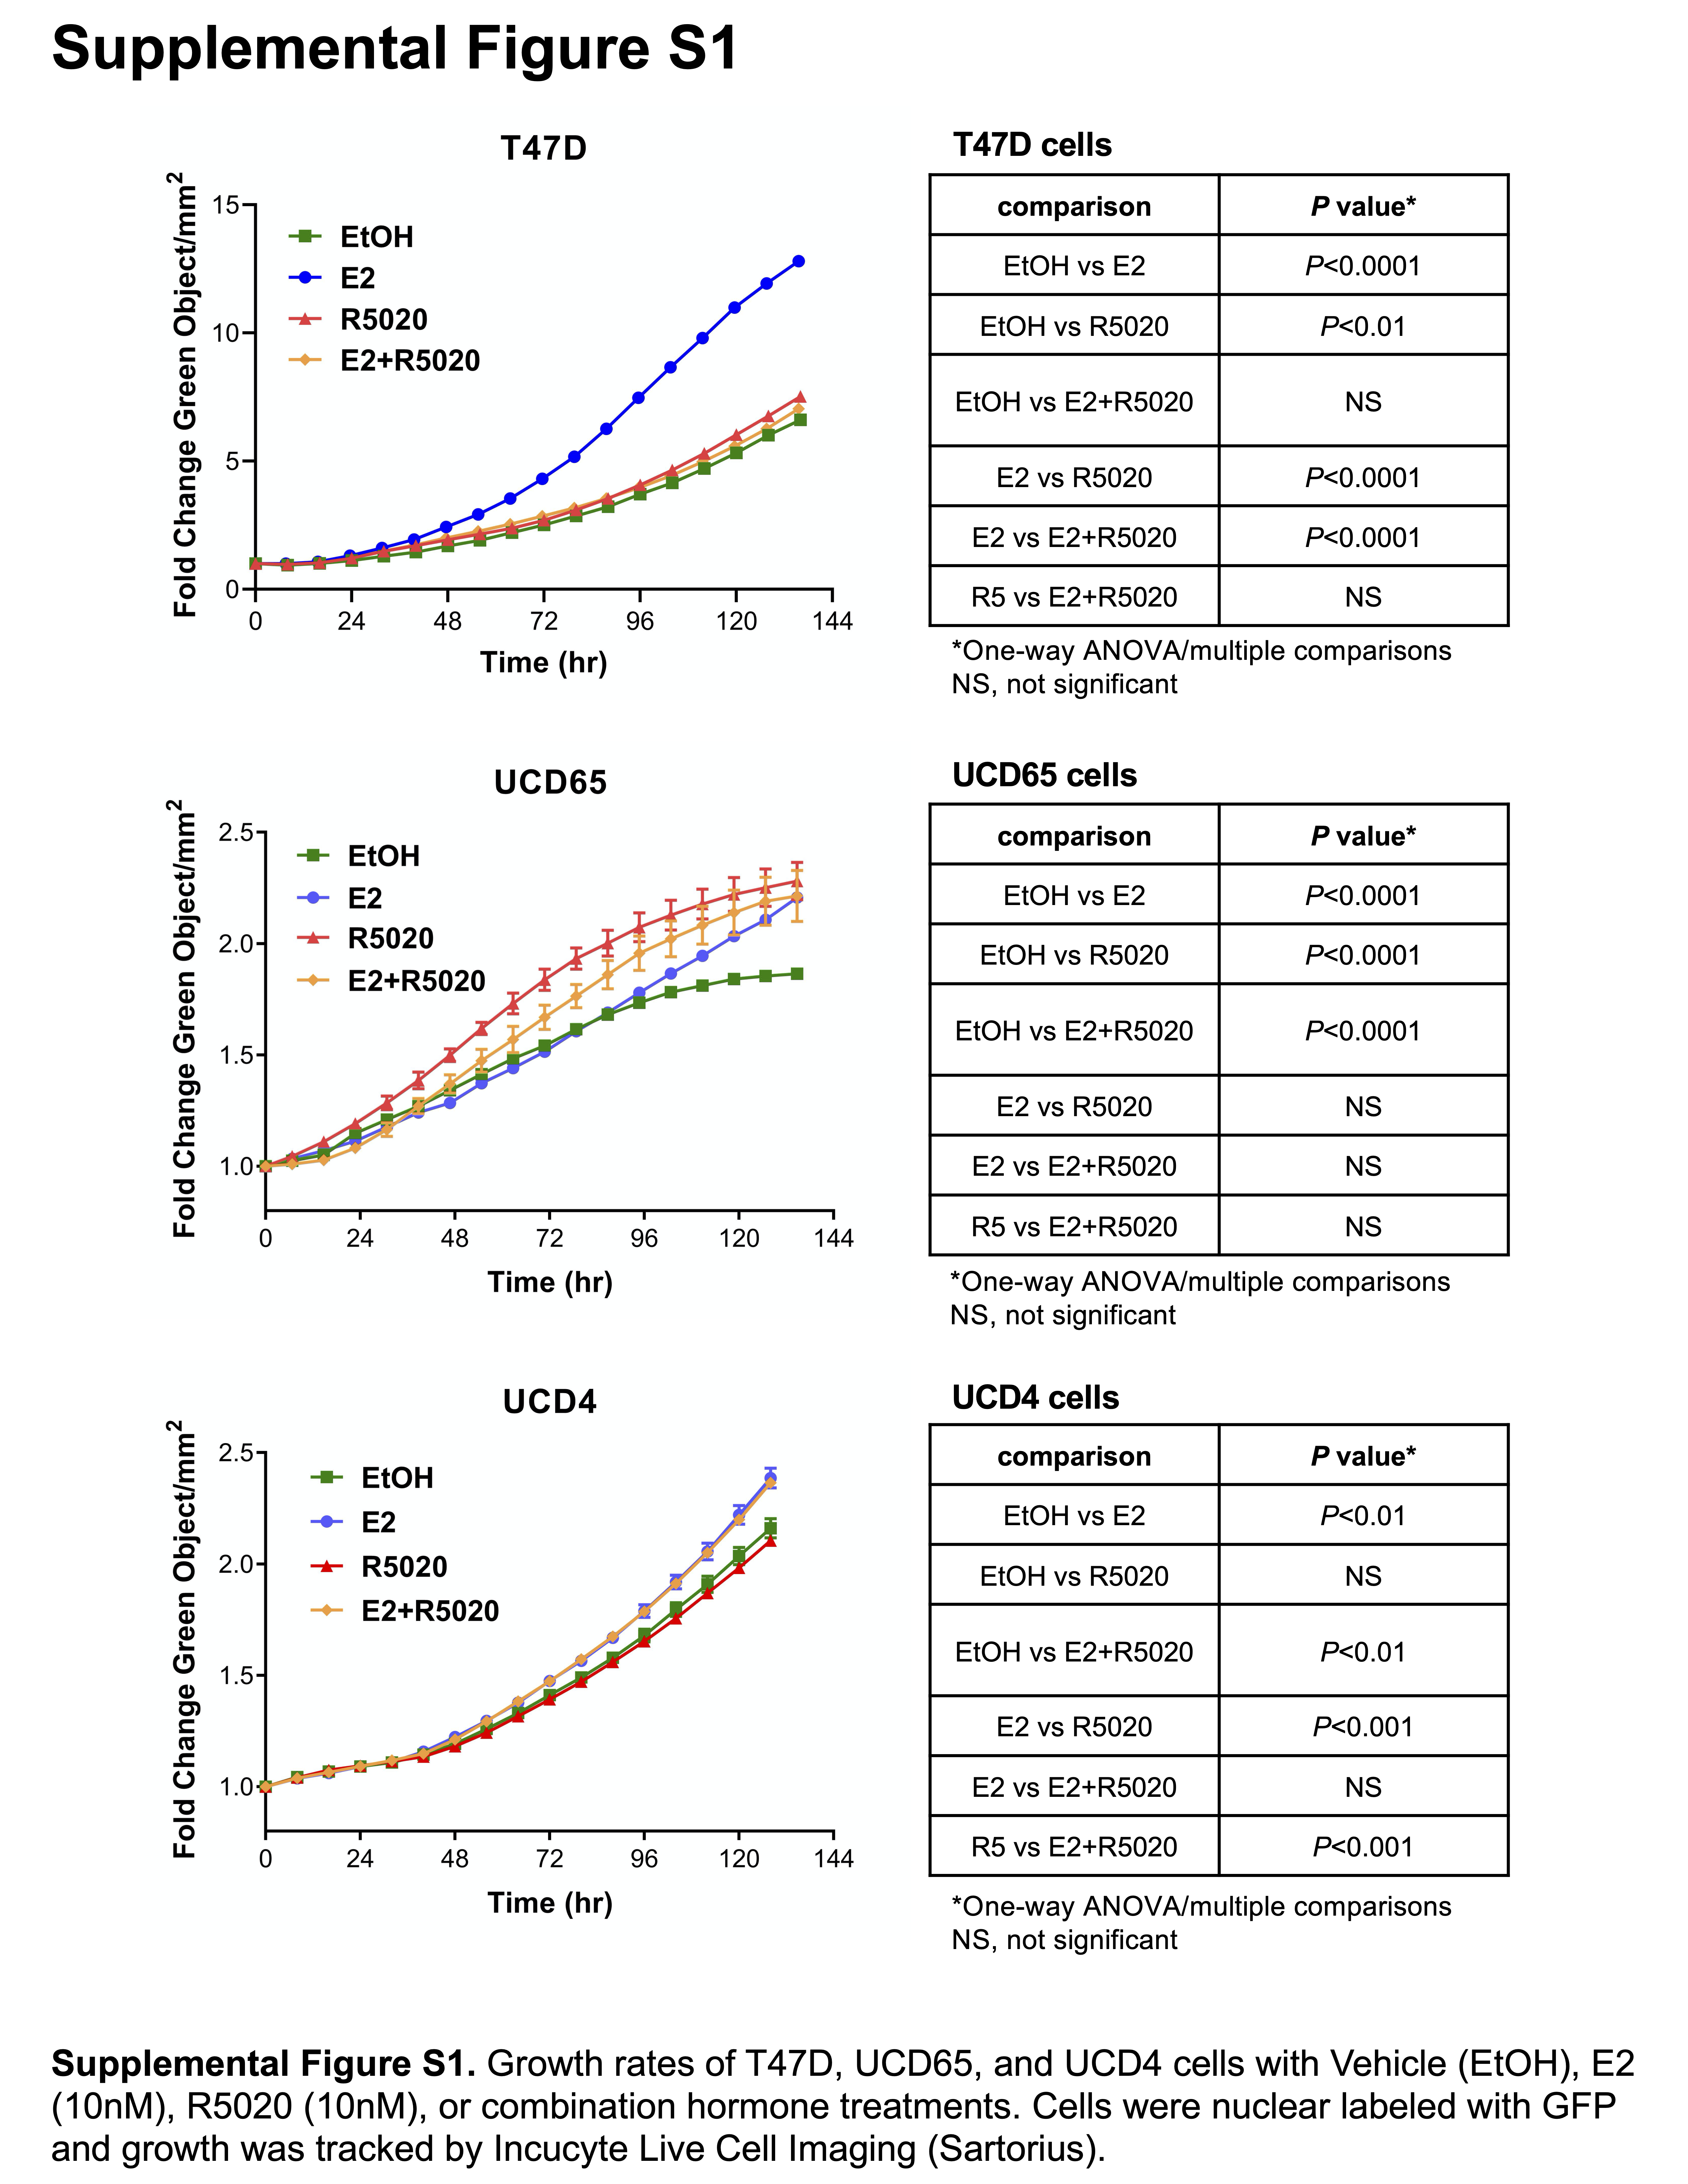
The breast cancer cell line T47D was obtained from the University of Colorado Cancer Center Tissue Culture core (RRID: CVCL_0553) and was maintained in minimal Eagle’s medium, 5% fetal bovine serum (FBS), 1X non-essential amino acids, 1x10⁻⁹ M insulin, 0.1 mg/mL sodium pyruvate, and 2 mM L-glutamine. Development of ER+PR+ breast cancer PDX UCD4 and UCD65 has been previously described (13, 31). The UCD4 and UCD65 cell lines were derived from their corresponding PDXs and remain ER+PR+ (32). The UCD65 and UCD4 cell lines were maintained in DMEM/F-12 1:1 with 10% FBS, 1x10⁻⁹ M cholera toxin, 1x10⁻⁹ M hydrocortisone, and 1x10⁻⁹ M insulin. Cell lines were authenticated using short tandem repeat (STR) analysis using the University of Arizona Genetics Core (University of Arizona, Tucson, AZ). For UCD65 and UCD4, cells were matched to the original PDX and not to any other cell lines in the database. All cell lines were routinely tested for mycoplasma contamination using the MycoAlert mycoplasma detection kit (Lonza, Basel, Switzerland). In vitro hormone experiments were performed using phenol red-free media with the same additives described above. Hormone treatment was used as follows: 17-b-estradiol (E2), 10-8 M (Sigma-Aldrich, St. Louis, MO); R5020, 10-8 M (PerkinElmer, Waltham, MA); or progesterone (P4), 10-7 M (Sigma-Aldrich), or the combination of E2 plus R5020 (both 10-8 M) for 24 h unless otherwise indicated. PR expression was induced in UCD65 and UCD4 cells by E2 pre-treatment for a minimum of 24 h prior to experiment start.
Animal experiments
All animal experiments were performed under a protocol approved by the University of Colorado Institutional Animal Care and Use Committee. For T47D xenografts, 1x10⁶ cells were injected into the mammary fat pad of female NOD/SCID/ILIIrg−/− (NSG) mice supplemented with E2 or E2+P4 pellets as previously described (15). PDX tumors were partitioned and grown in female NSG mice supplemented with subcutaneous silastic pellets containing E2 or E2+P4 as previously described (33, 34).
Metabolomics
Metabolites were extracted from T47D, UCD65, and UCD4 cell pellets in quadruplicate using ice-cold lysis/extraction buffer (5:3:2 methanol:acetonitrile:water) at a concentration of 2x10⁶ cells per mL. Metabolomics and analyses were performed using the University of Colorado Cancer Center’s Mass Spectrometry Metabolomics Shared Resource essentially as described (35, 36). Briefly, after sample randomization, 10 μL of extracts were injected into a Thermo Vanquish UHPLC system (San Jose, CA) and resolved on a Kinetex C18 column (150 × 2.1 mm, 1.7 μm, Phenomenex, Torrance, CA) at 450 μL/min through a 5 min gradient from 5 to 95% organic solvent B (mobile phases: A = water, 0.1% formic acid; B = acetonitrile, 0.1% formic acid in positive ion mode or mobile phases: A = 18 mΩH2O, 1 mM ammonium acetate; B = acetonitrile, 1 mM ammonium acetate for negative ion mode). Untargeted data acquisition, quality control, and targeted data analysis were performed as previously described (37). Precipitated protein was reconstituted in PBS and measured using BCA protein assay (Pierce, Thermo Fisher, Waltham, MA). Metabolomics intensity signals were normalized to sample protein concentration. The metabolomics dataset supporting the conclusions of this article has been deposited to the MetaboLights database (RRID:SCR_014663), with the identifier MTBLS2138. The complete dataset can be accessed here: https://www.ebi.ac.uk/metabolights/index.
Normalized data was imported into MetaboAnalyst software (RRID:SCR_015539) (38), where data was log-transformed and autoscaled (39). Partial least squares discriminant analysis (PLS-DA) was performed on all samples within cell lines for visual inspection of clustering patterns and outlier detection. Heatmaps were constructed using Pearson distance with average linkage and depict non-scaled PLS-DA variable importance in projection (VIP) averaged across replicates (N=4) within treatment groups.
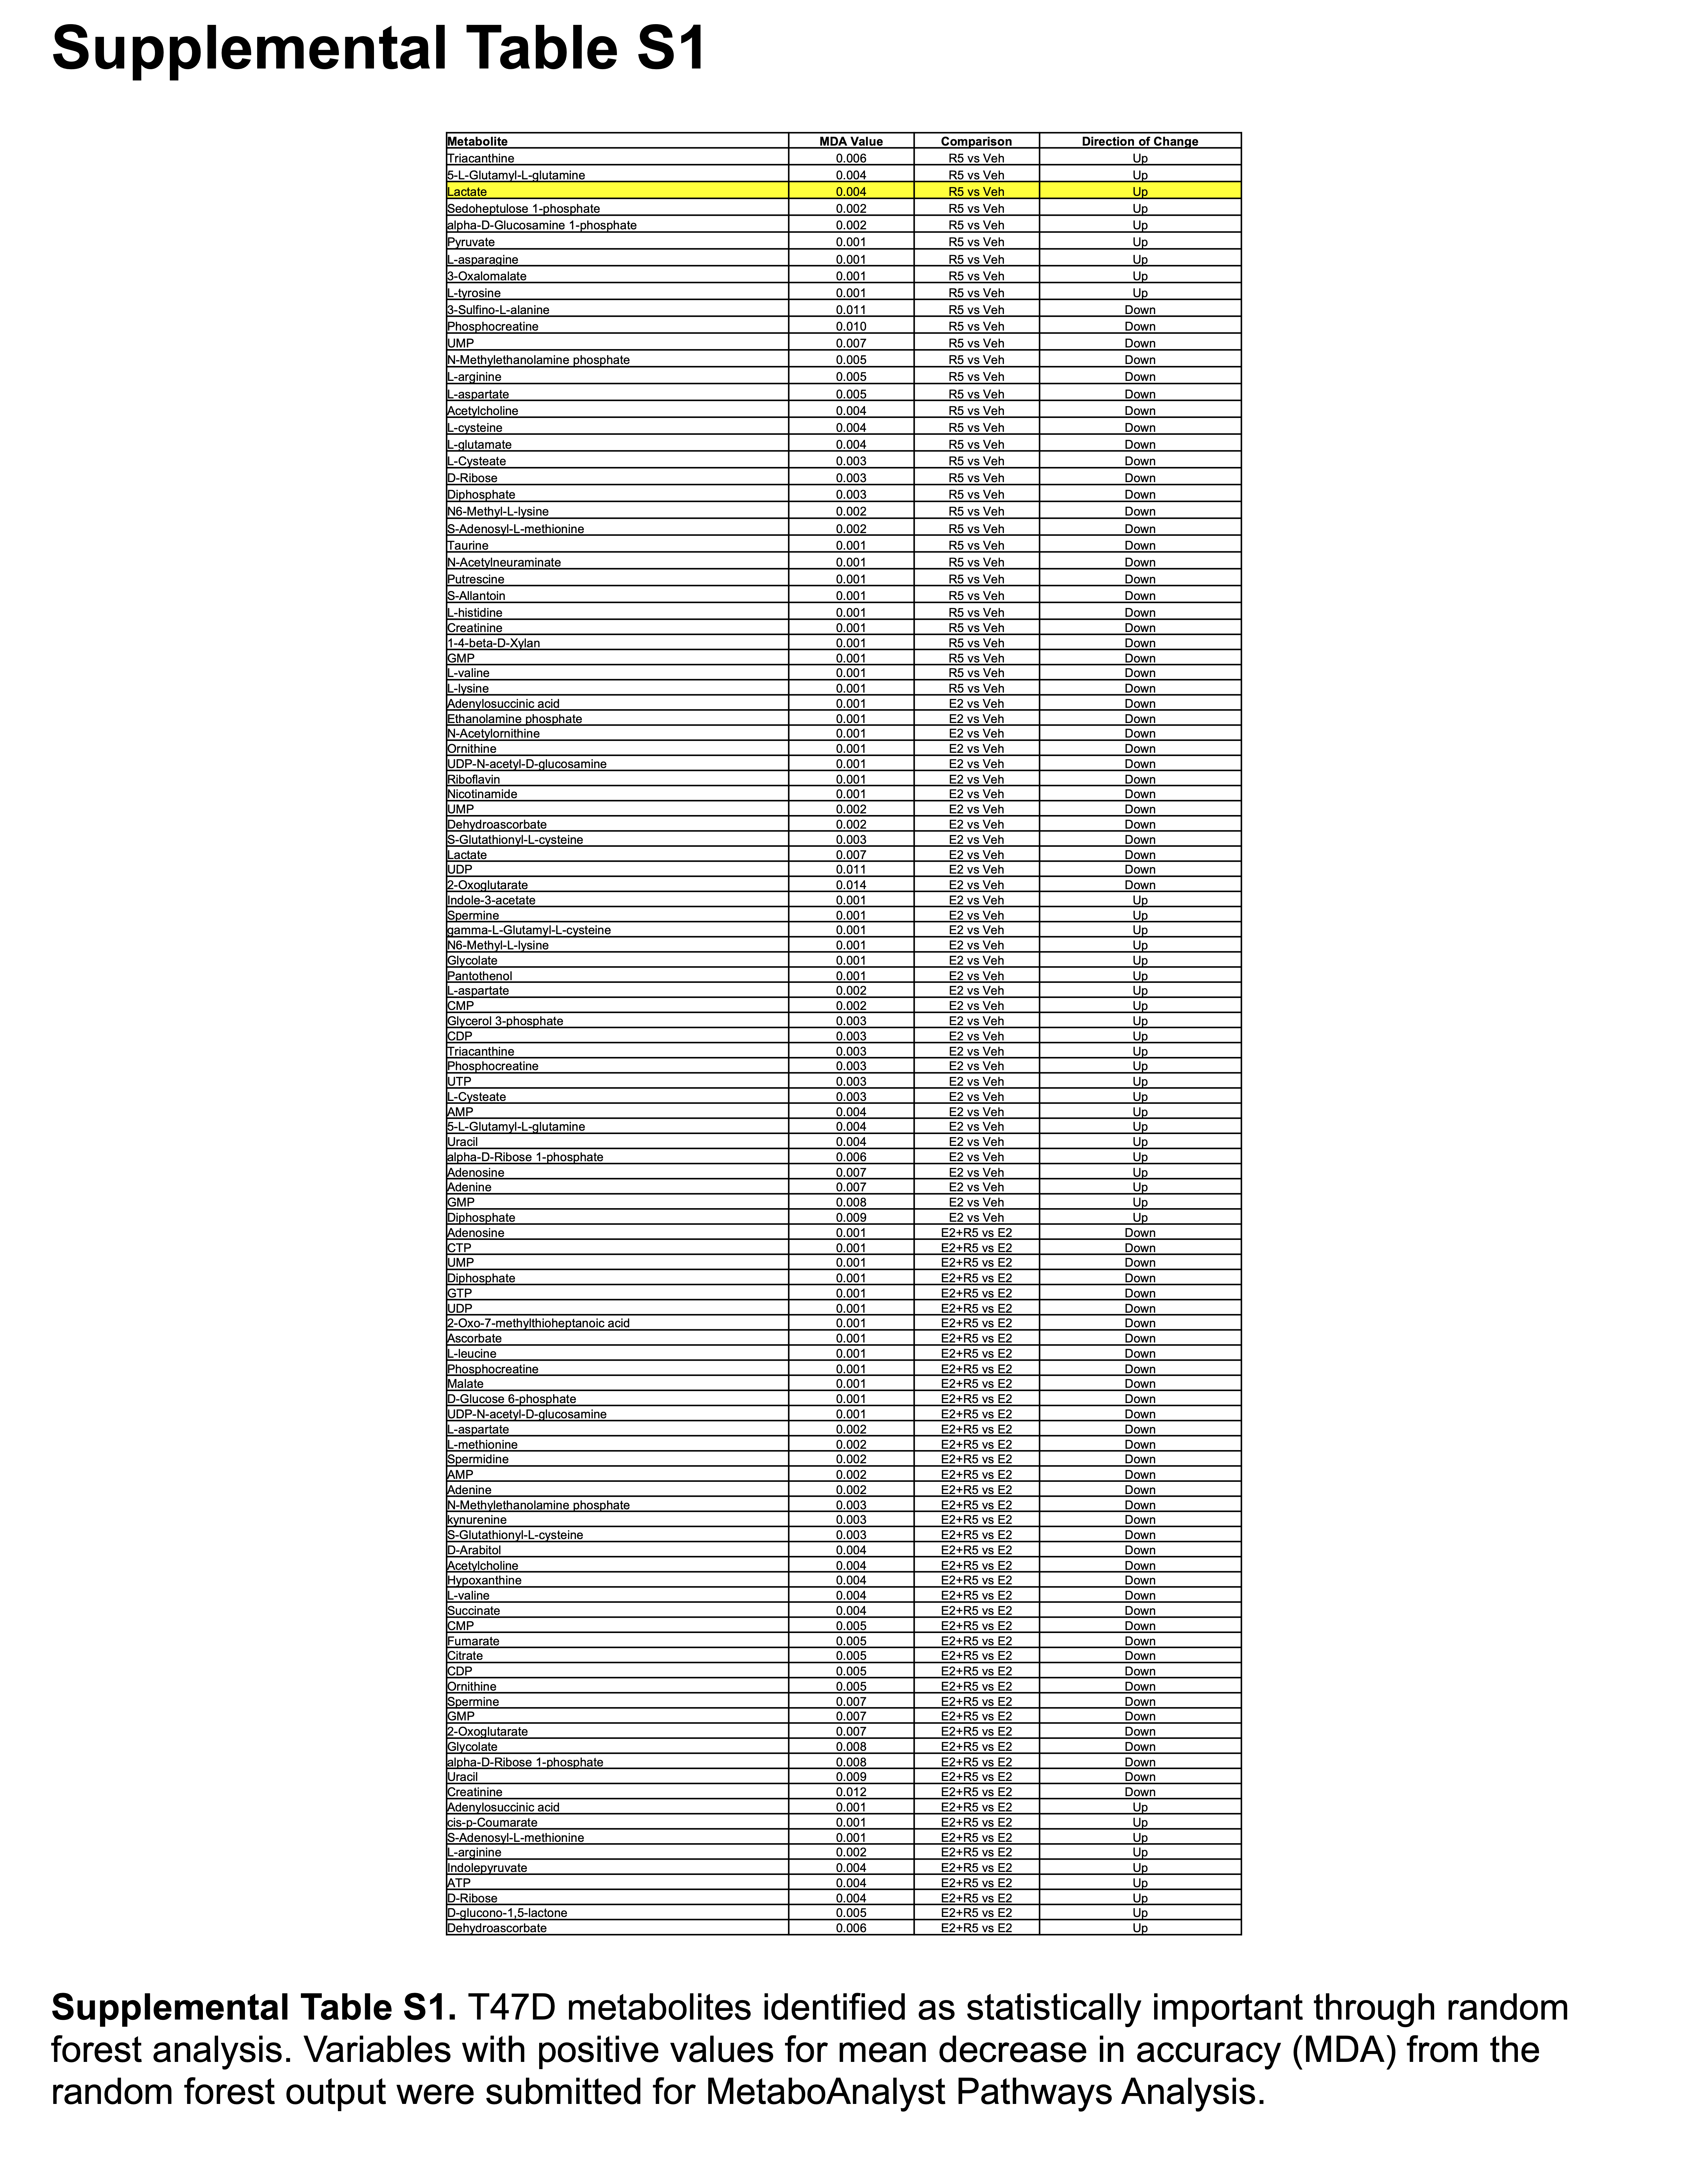
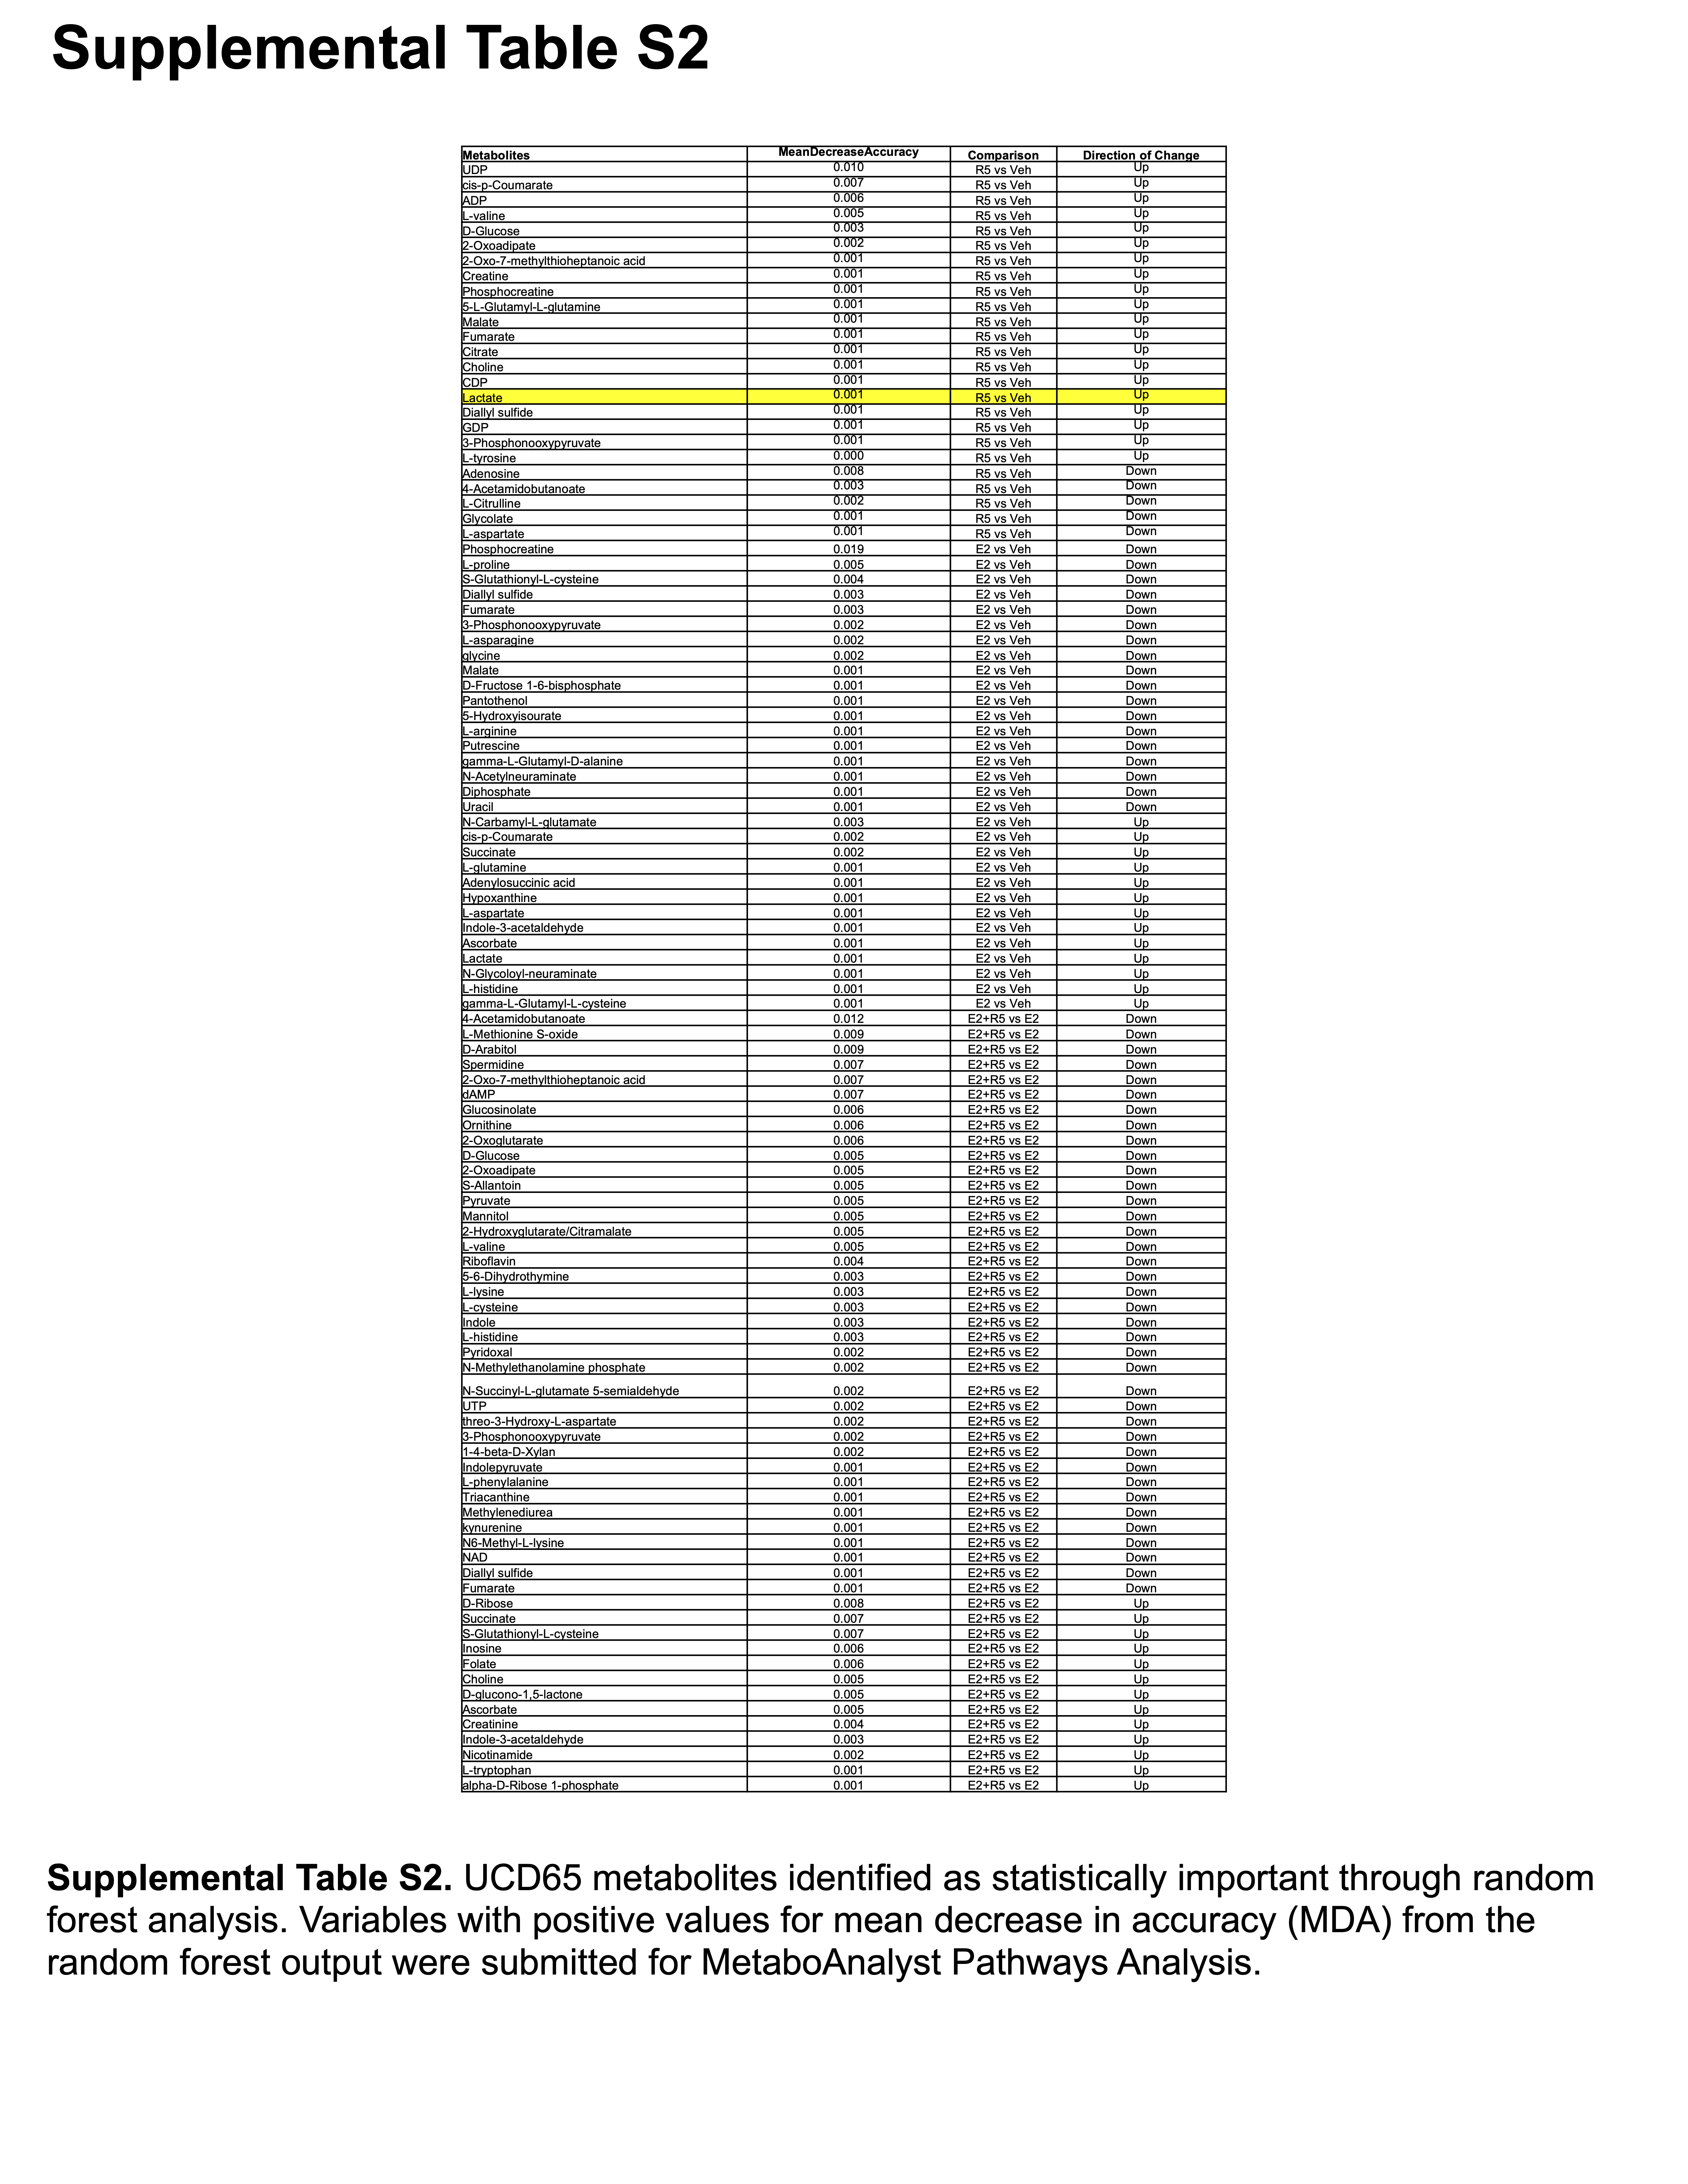
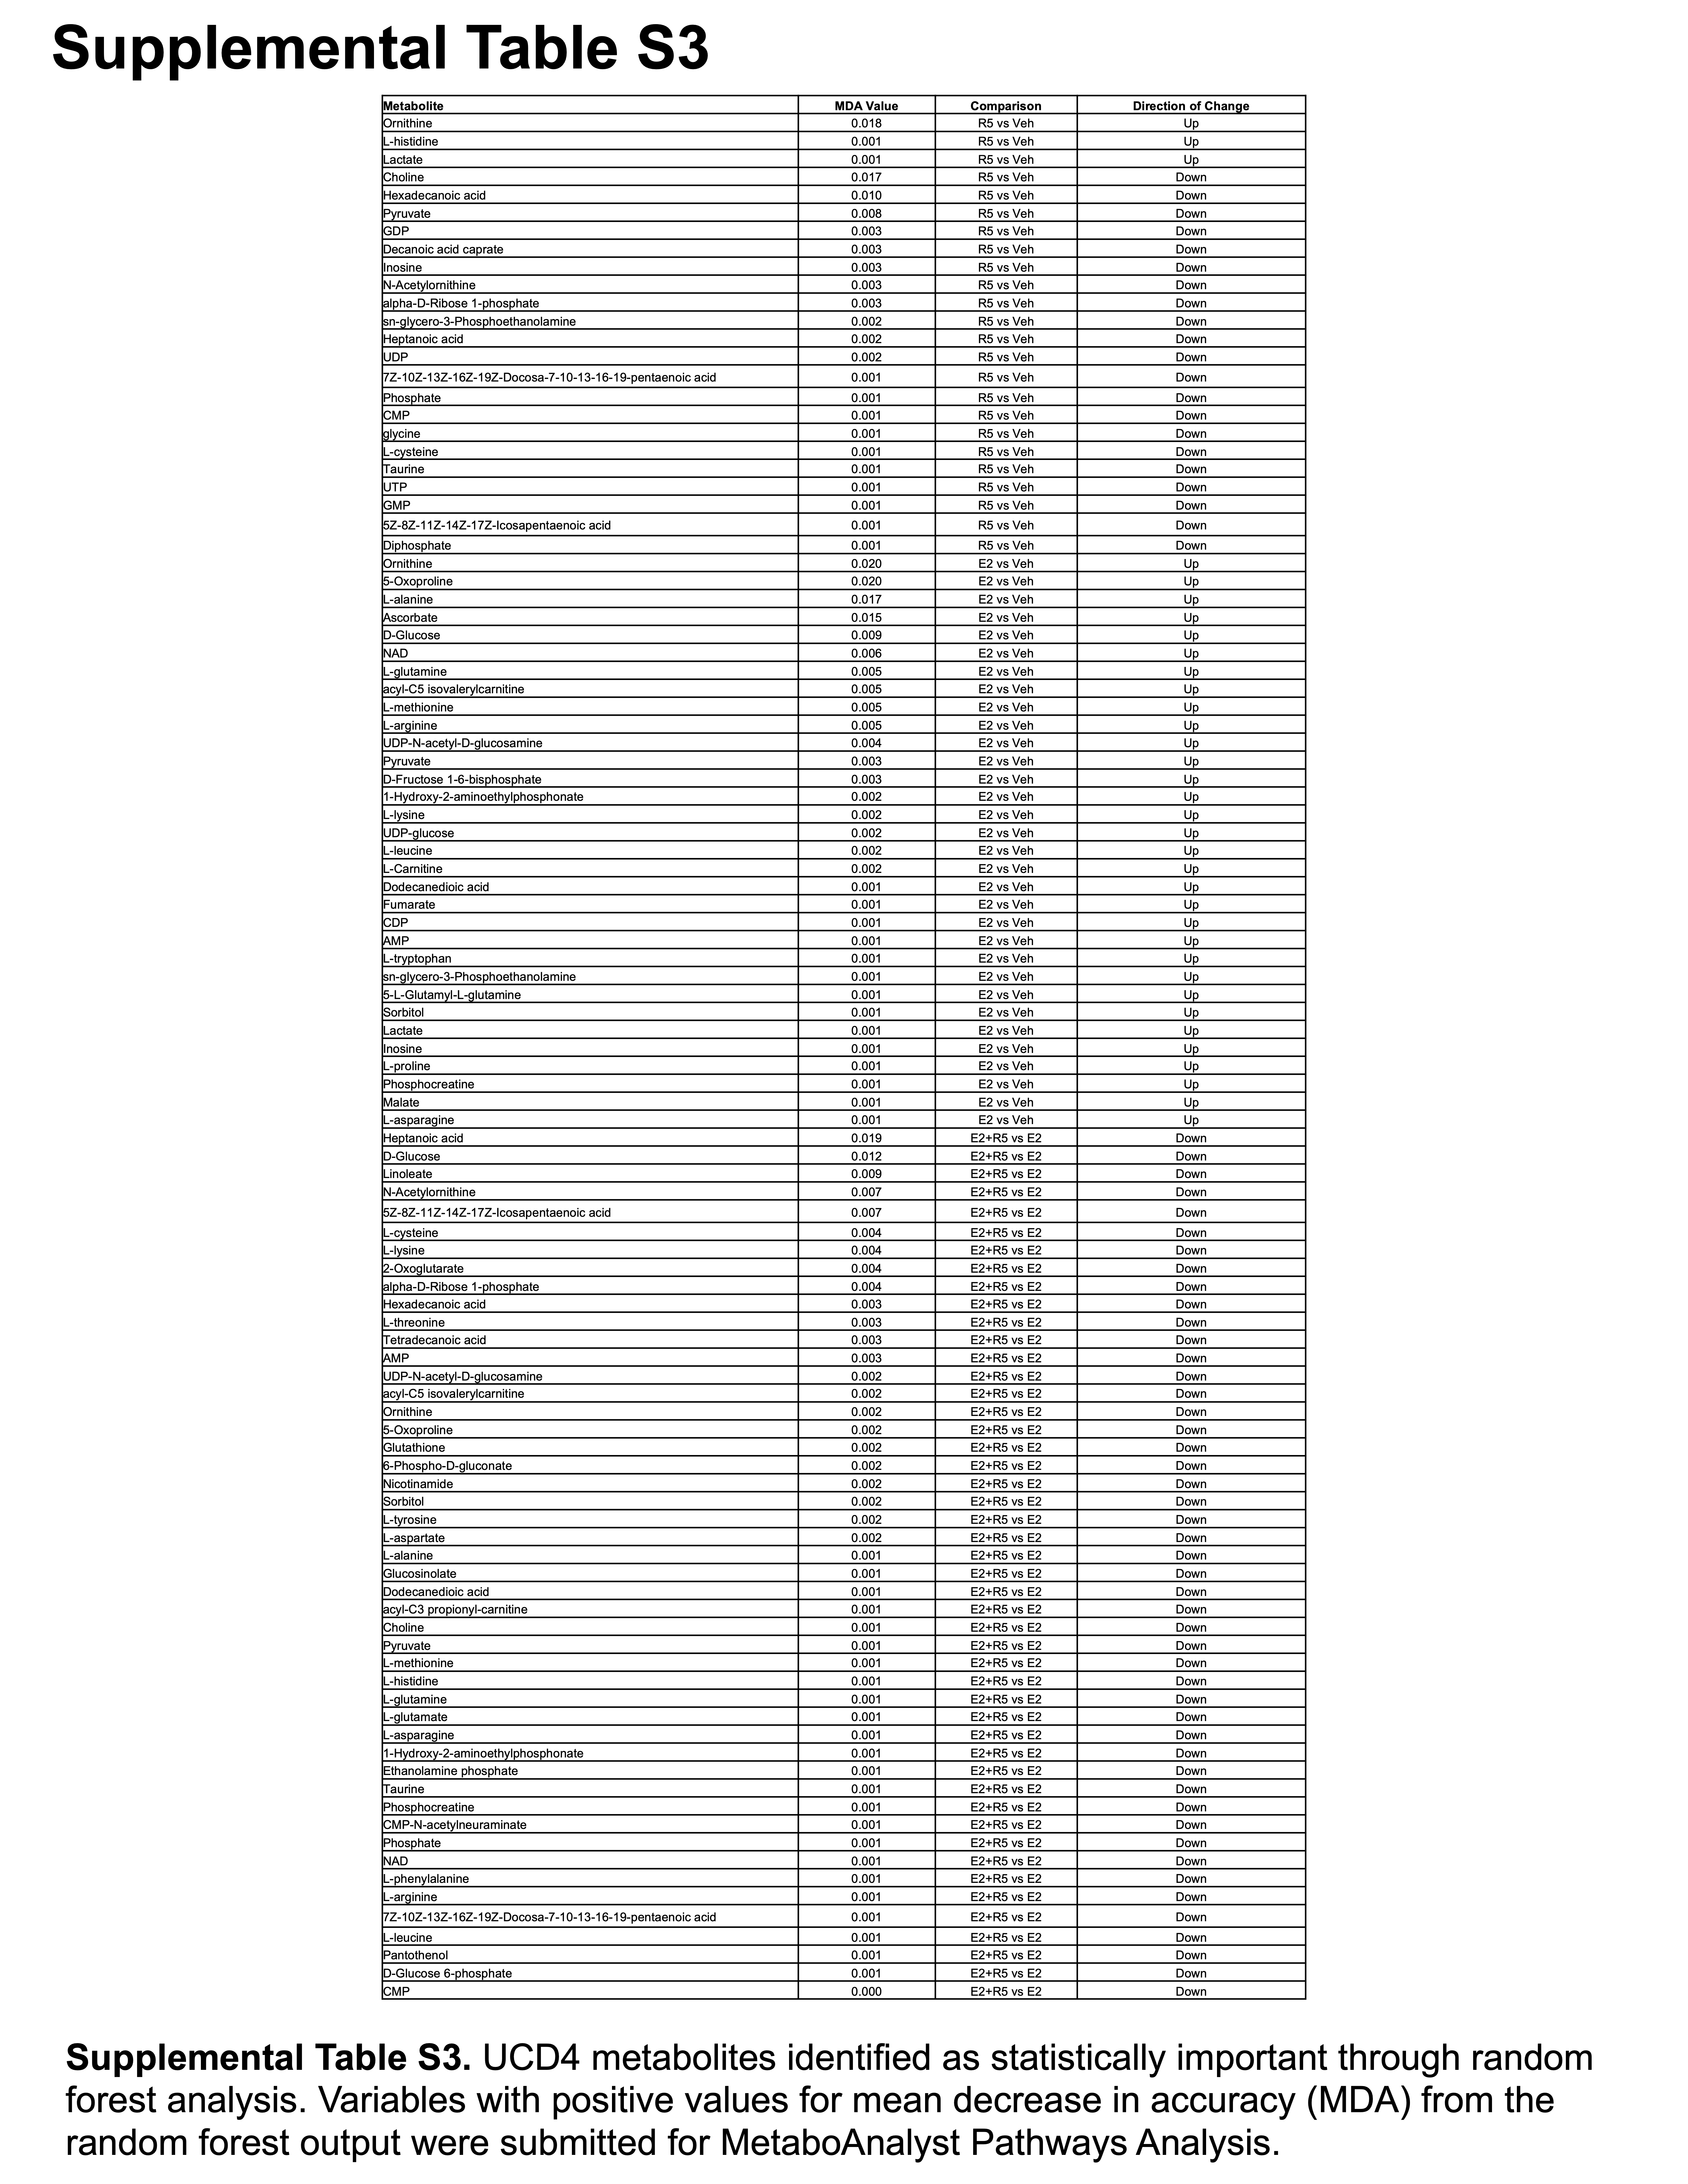
For pathway analysis, pairwise comparisons of E2-treated vs. E2+R5020-treated cells were used. Metabolites from random forest variable importance analysis with mean decrease in accuracy >0 were evaluated for fold-change direction (lower in E2+R5050 vs. E2, called “down”; higher in E2+R5020 vs. E2, called “up”). These subsets of metabolites were submitted to MetaboAnalyst Pathway Analysis (MetPA) and can be found in Supplementary Table S1 for T47D cells, Supplementary Table S2 for UCD65 cells, and Supplementary Table S3 for UCD4 cells. Pathways were identified using default settings; specifically, the hypergeometric test for overrepresentation analysis and relative betweenness centrality was used for pathway topology analysis, with pathways mapped to the Homo sapiens KEGG reference library.
Seahorse metabolic phenotyping
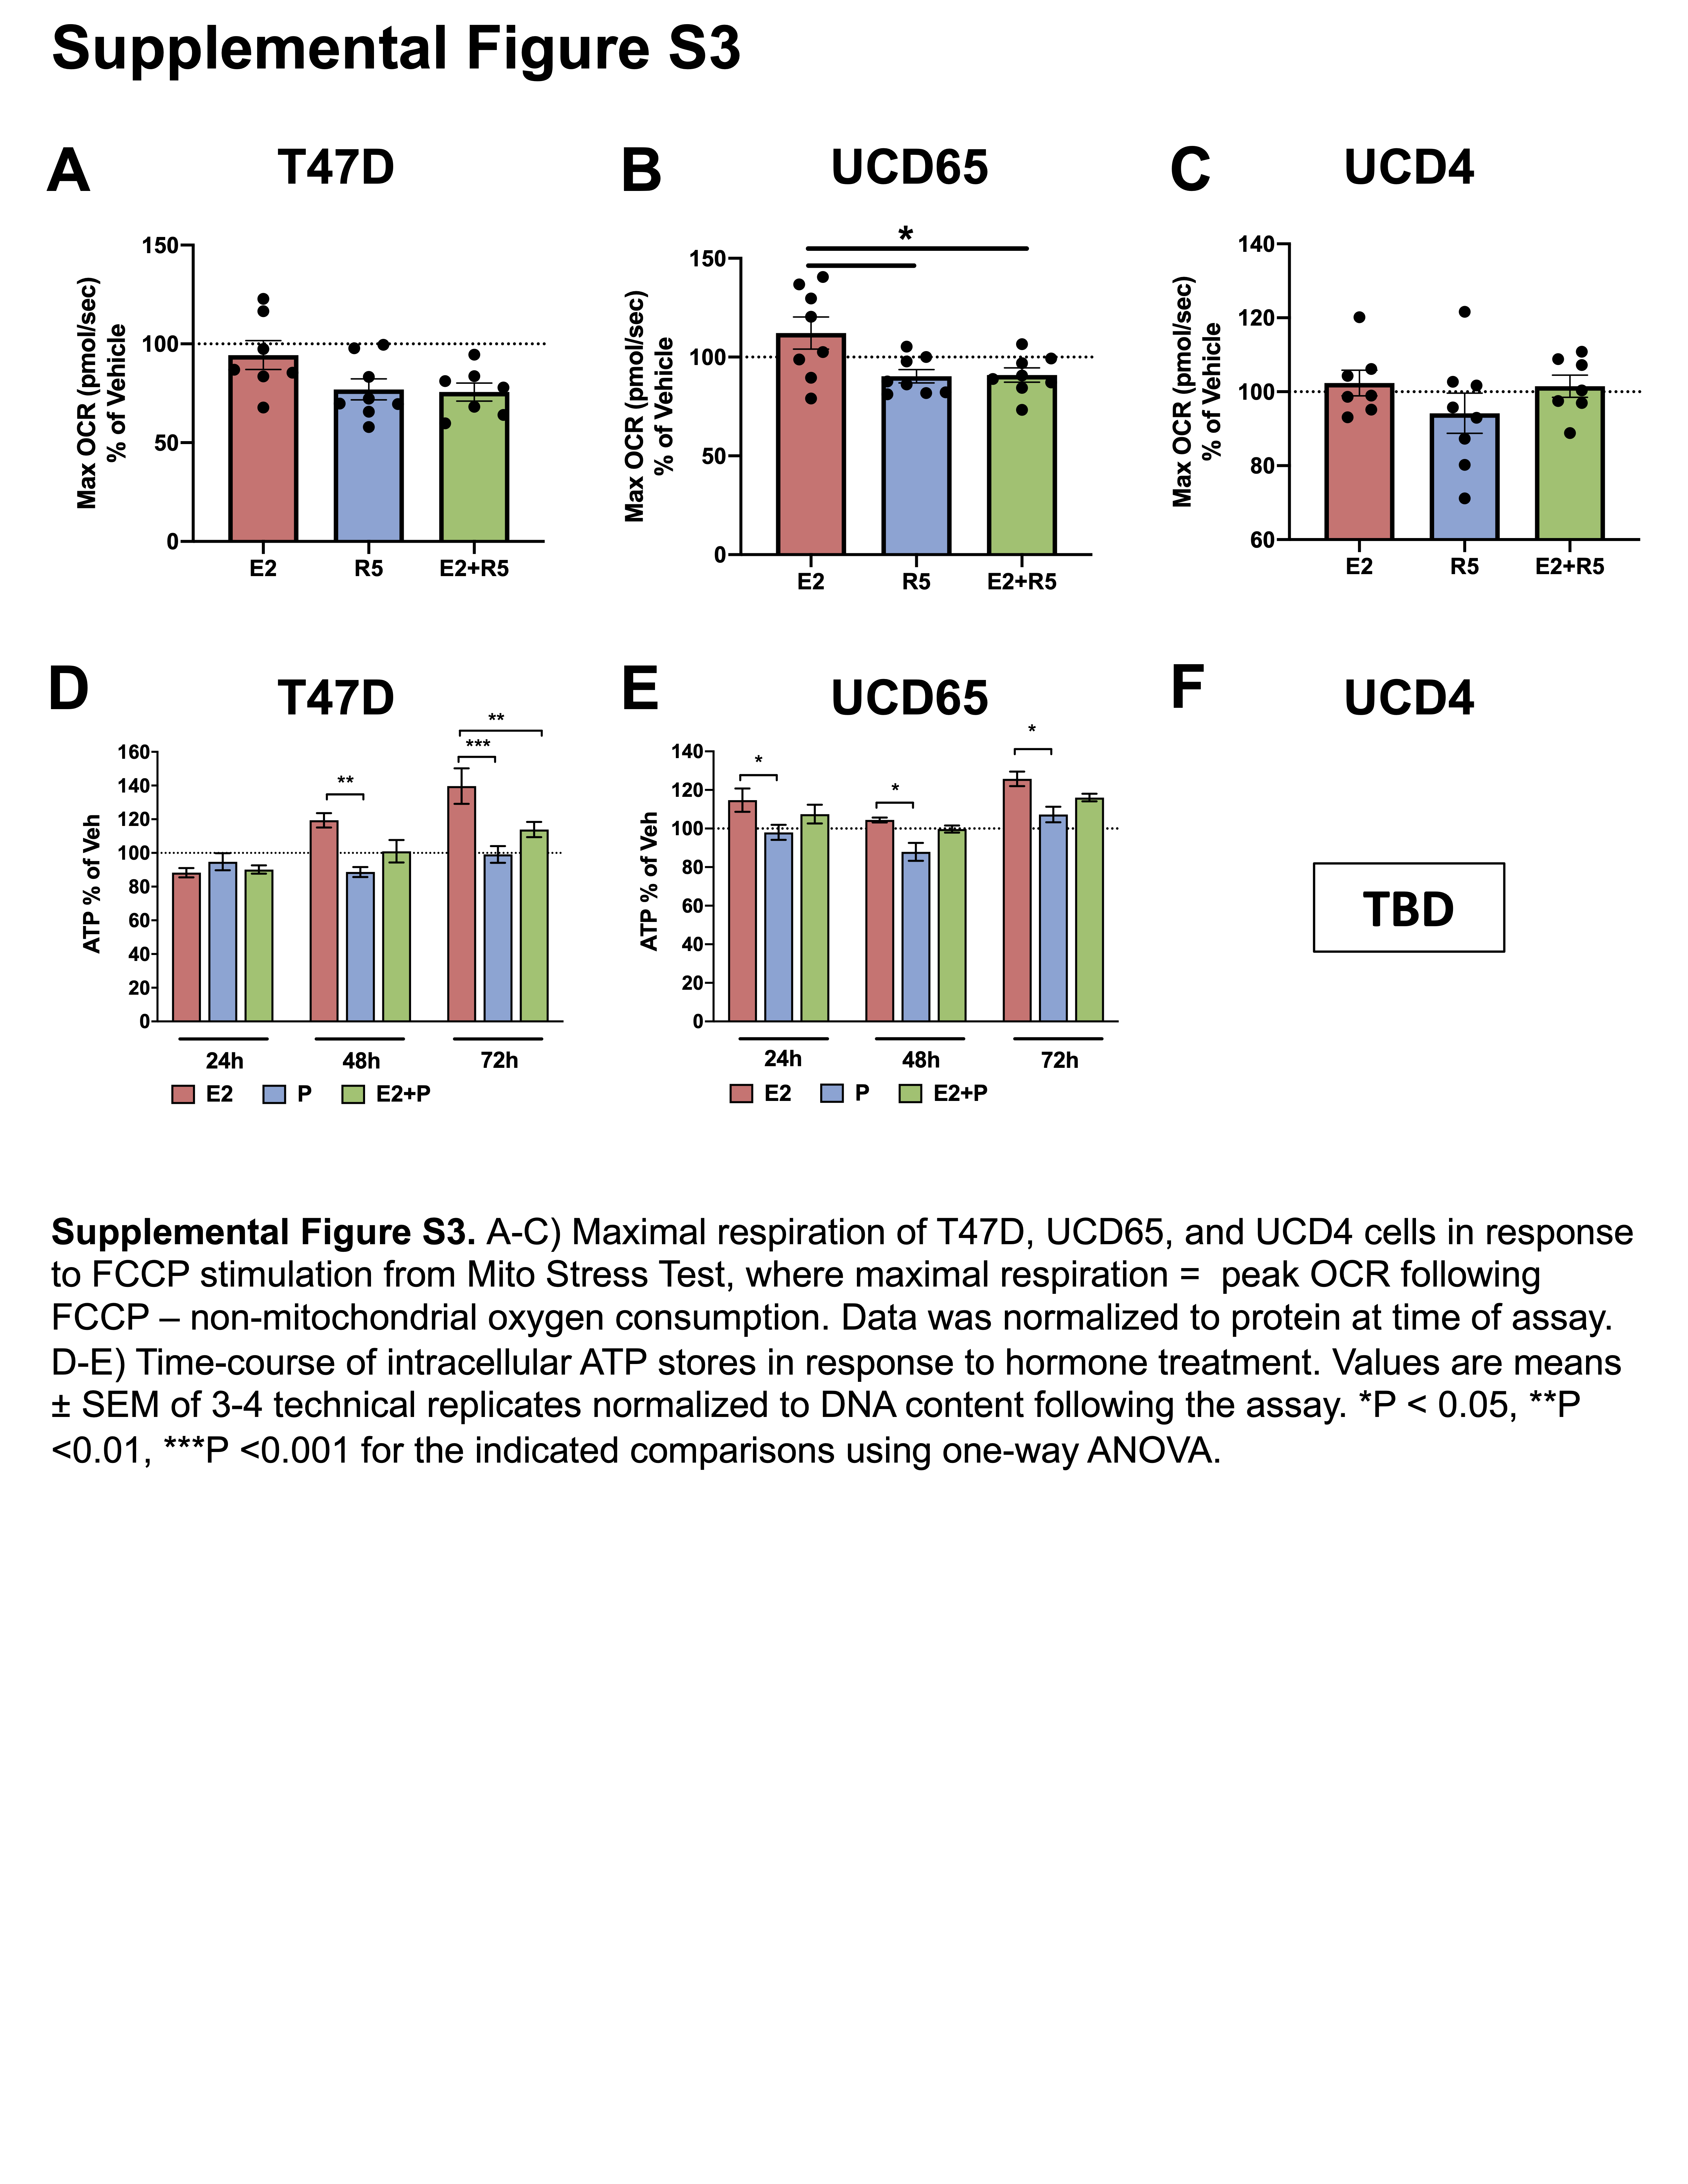
Metabolic phenotype was determined using the Seahorse XFe96 Extracellular Flux Analyzer (Agilent, Santa Clara, CA). T47D, UCD65, and UCD4 cells were cultured in the presence of vehicle (0.2% ethanol), E2 (10-8 M), R5020 (10-8 M), or E2 plus R5020 (10-8 M each) for 24 h and assessed via the Mito Stress Test kit (Agilent). Samples were analyzed with 7-8 replicates per treatment. Cell count at time of assay was used for data normalization and obtained using the Cytation 1 Cell Imaging Multi-Mode Reader (BioTek) with Hoescht 33342 (Sigma) fluorescent staining.
ATP assay
Intracellular ATP was quantified using the ATP Fluorometric Assay from Novus Biologicals (#NBP2-54855, Biotechne, Cambridge, MA) according to the manufacturer’s protocol. Briefly, cells treated with hormones for 24, 48, or 72 h were lysed in ice-cold assay buffer and deproteinized using the Deproteinizing Sample Preparation Kit (#K808-200, BioVision, LLC, Milpitas, CA) according to the manufacturer’s protocol and assayed under fluorimetric conditions (Ex 535/Em 587) in triplicate. Results are representative of at least 3 experiments.
Transmission electron microscopy
Cells were cultured on PermaNox 60-cm dishes (VWR, Radnor, PA). Excised tumors were cut into approximately 1 mm3 pieces. Cultured cells and tumor pieces were fixed with 2% paraformaldehyde and 2.5% glutaraldehyde in 0.1 M phosphate buffer and then post-fixed with reduced osmium (1.5% potassium ferrocyanide + 1% osmium tetroxide) followed by 2% osmium tetroxide. Samples were dehydrated with a graded series of ethanol and embedded in a thin layer of Epon. Following Epon curing, small pieces were cut out and re-embedded in blocks that were sectioned at 65 nm on an ultramicrotome, collected on formvar coated slot grids, and post-stained with 2% osmium tetroxide and lead citrate.
At least 10 fields per treatment were imaged and blinded prior to analysis. Mitochondrial length along the longest axis was measured using Fiji and plotted via histogram, with bin mode indicated on the X-axis. Outliers greater than 3 standard deviations outside the mean of the full dataset were excluded. Differences in distributions were analyzed using the Kolmogorov-Smirnov test for frequency distributions; comparisons for cells were 1) vehicle vs. E2 and 2) E2 vs. E2+R5020, while tumor samples were pooled by hormone treatment and compared E2 pellets vs. E2+P4 pellets.
MitoGFP and MitoTimer
T47D cells were labeled overnight with CellLights BacMam 2.0 MitoGFP (Thermo Fisher, Waltham, MA) according the manufacturer’s protocol. Cells were treated for 24 h with vehicle (EtOH), E2 (10-8 M) or P4 (10-7), or E2 + P4 for 24 h then were fixed in 4% paraformaldehyde, counterstained with DAPI, and mounted on coverslips. Images were collected using confocal laser scanning microscopy (Zeiss LSM 780) with 40X objective.
T47D cells were transduced to express the MitoTimer construct from Addgene (Watertown, MA) as previously described (40). Following stable transduction with the pLenti-CMV-rtTA3 Blast (w756-1) (Plasmid #26429, RRID:Addgene_26429) with >2 weeks blasticidin selection, cells were transiently transfected with pTRE-Tight-MitoTimer (Plasmid #50547, RRID:Addgene_50547) using Lipofectamine 3000 (Thermo Fisher, Waltham, MA). MitoTimer expression was induced by treatment for 1 hour with doxycycline (4 ug/ml, Cayman Chemical, Ann Arbor, MI), followed by washout and hormone treatment for 48h, at which point most mitochondria should be yellow to red. A second 1h dox pulse, followed by washout, was used to label a new wave of mitochondria corresponding to cells undergoing active biogenesis. Following an additional 6 h of hormone treatment, live cells (via IncuCyte ZOOM at 20X magnification or fixed cells (4% paraformaldehyde with DAPI counterstain) were imaged for analysis. Ten fields/condition (>200 cells each) were quantitated for green/red intensity using ImageJ/Fiji in a blinded manner and plotted as green:red ratio for each cell.
Real-time quantitative PCR (qPCR)
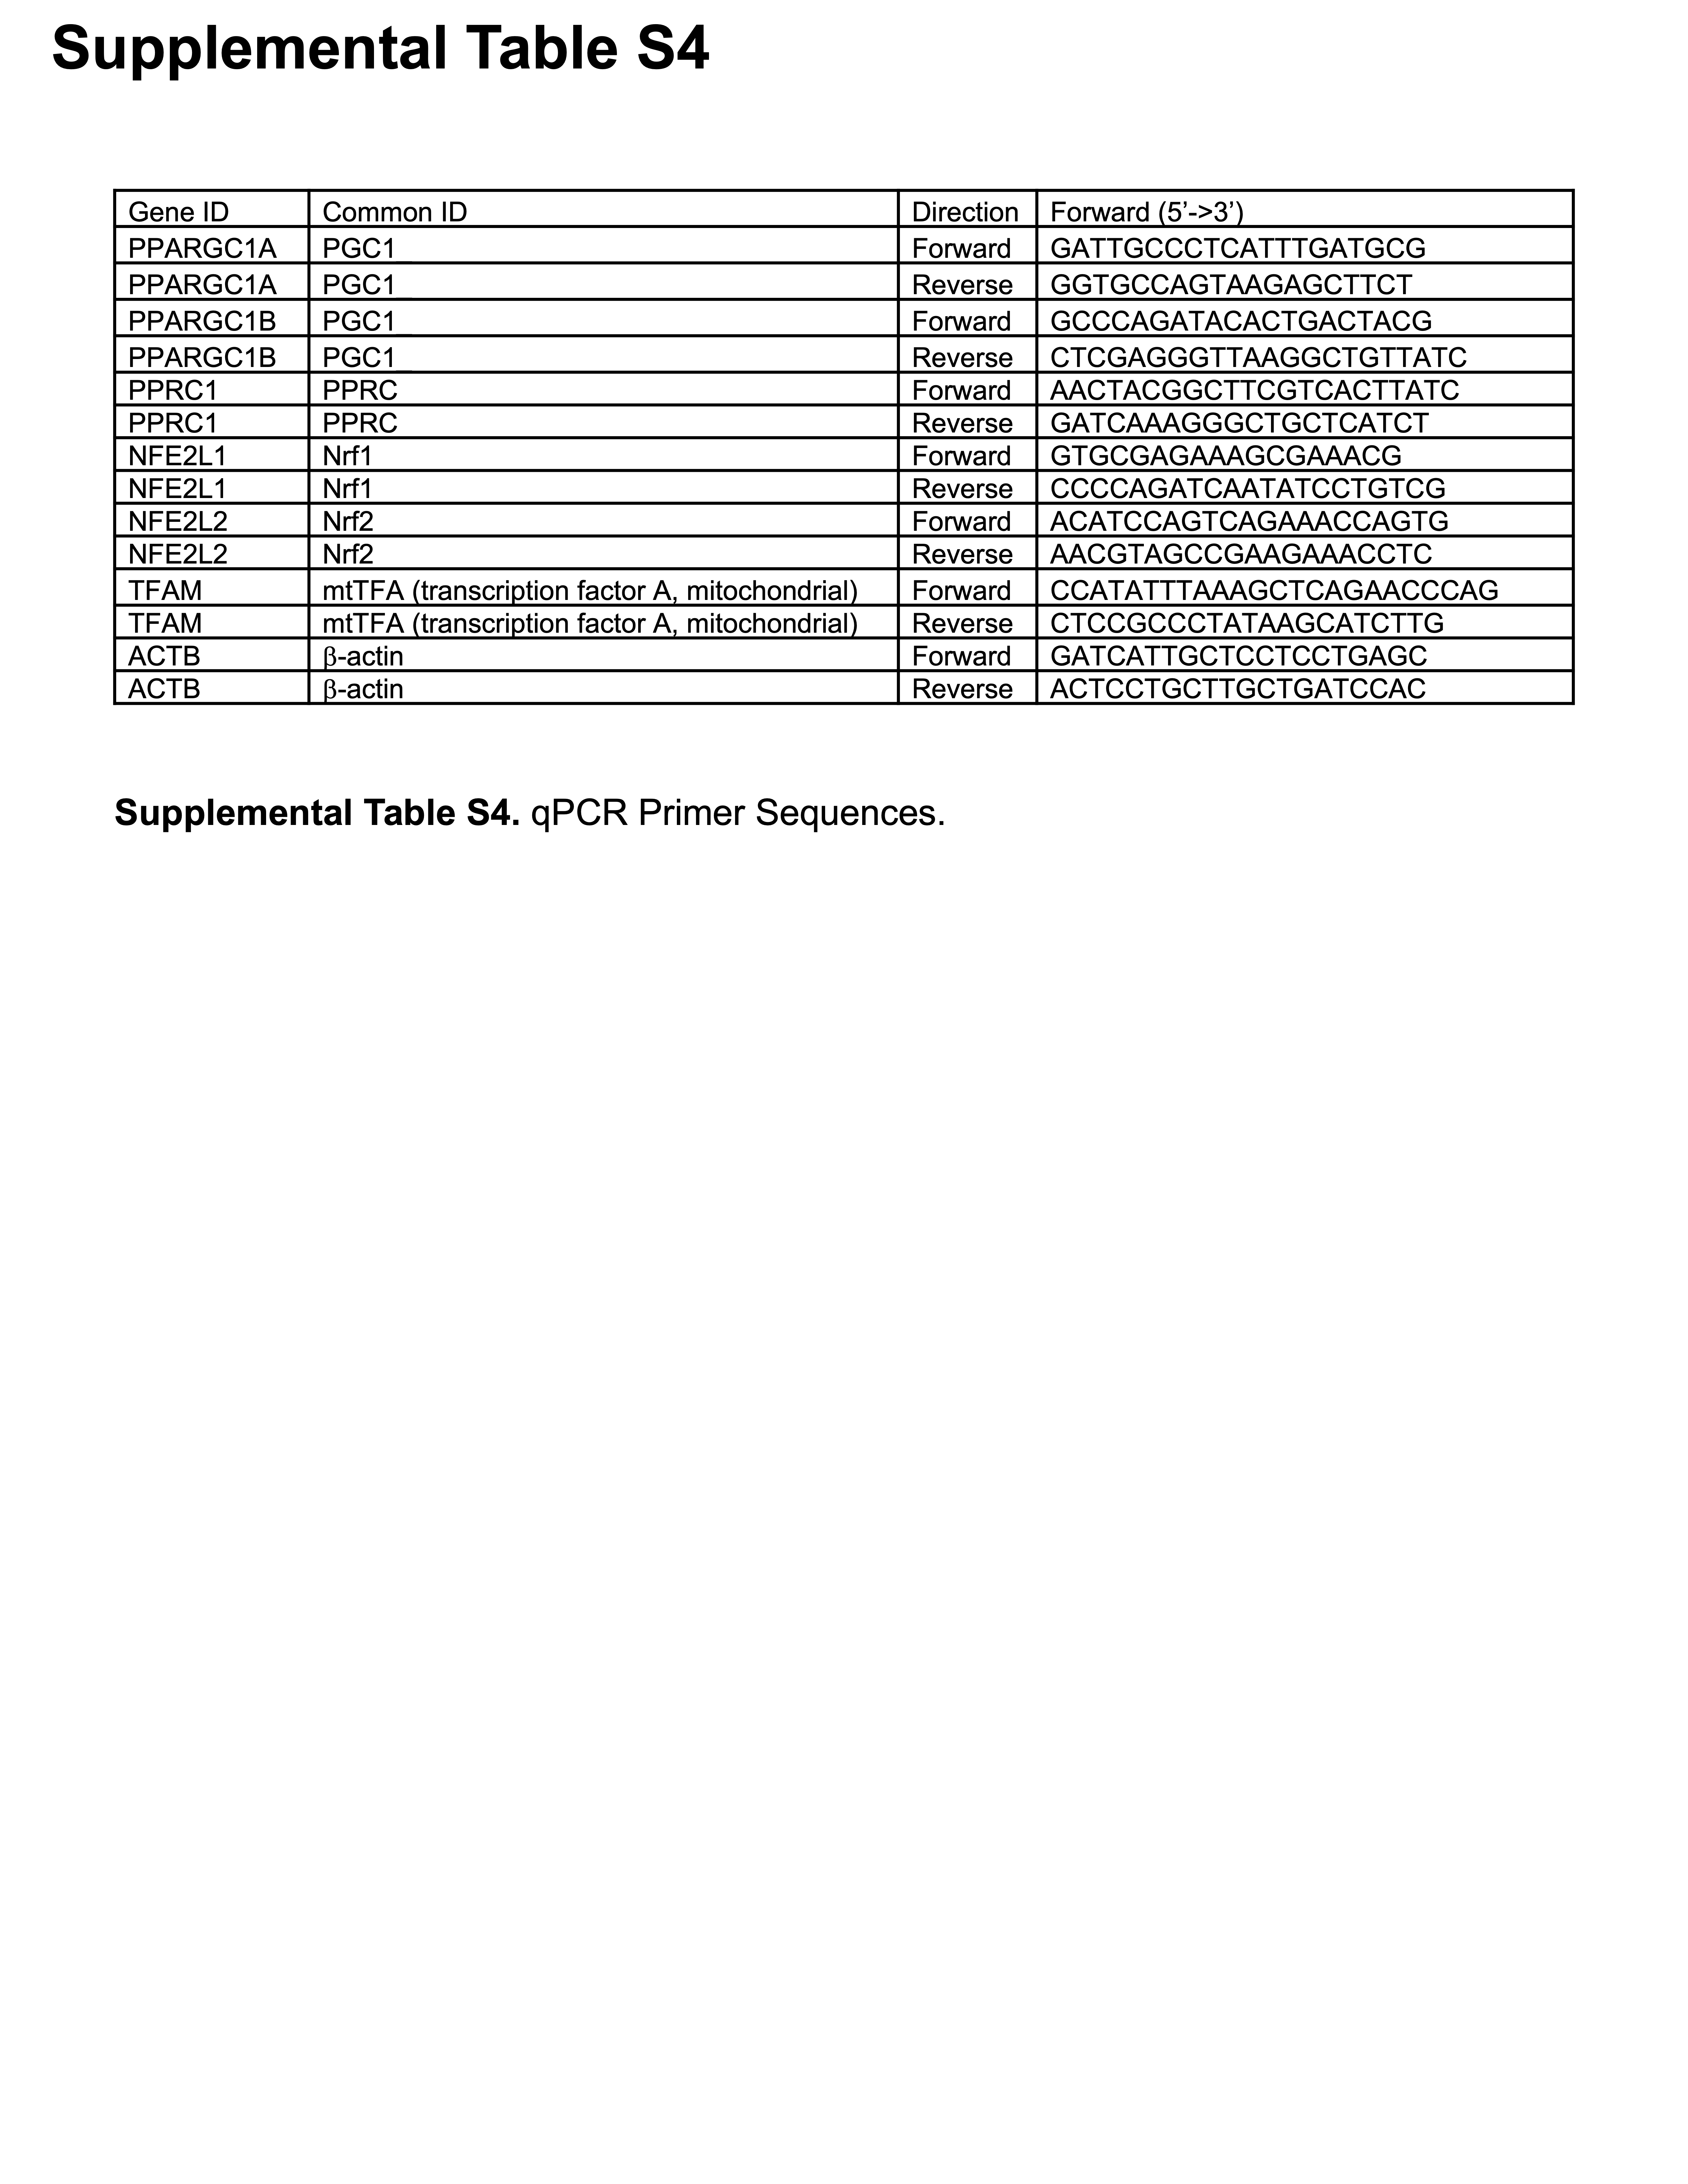
RNA was harvested using QIAzol lysis reagent (Qiagen, Venlo, the Netherlands) and converted to cDNA using the Verso cDNA kit (Thermo Fisher, Waltham, MA). qPCR was performed on cDNA using ABsolute Blue Sybr Green (Thermo Fisher, Waltham, MA) and normalized to β-actin using the Pfaffl method (41). qPCR primers are provided in Supplemental Table S4. Results are representative of 3-4 experiments.
L-amino acid assay
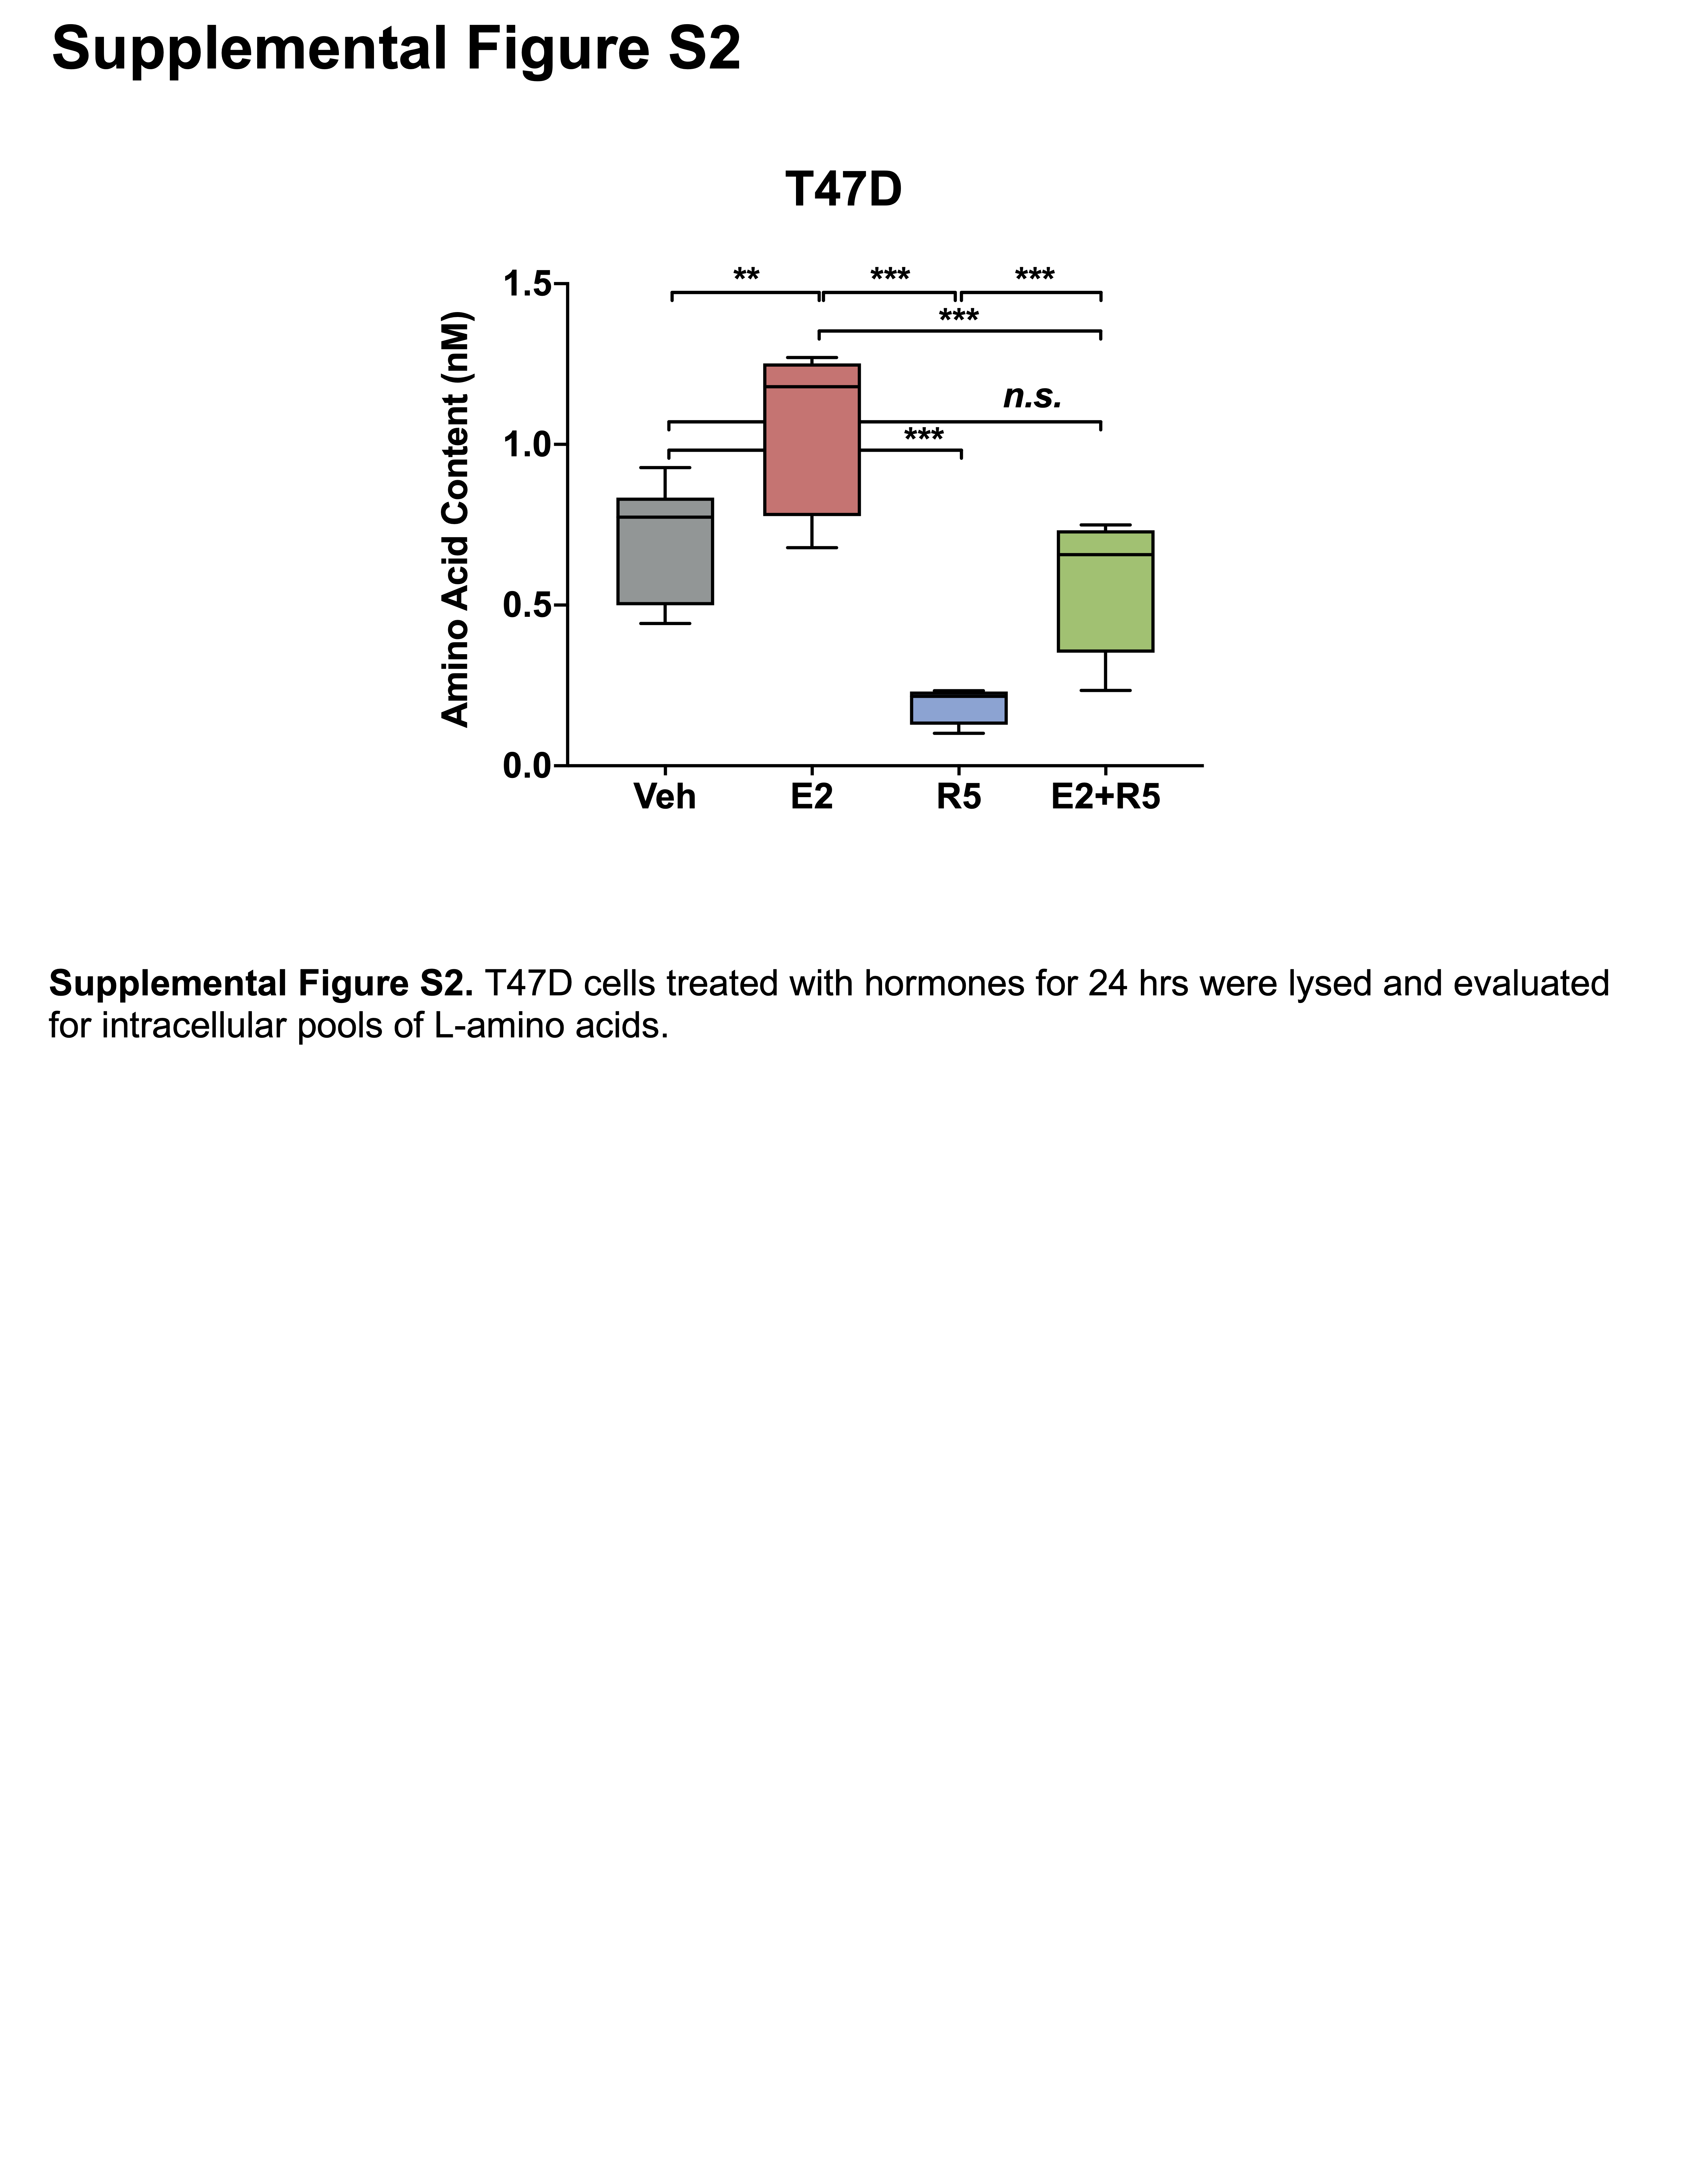
Amino acids were measured using the L-Amino Acid Quantitation Kit (#MAK002, Sigma-Aldrich, St. Louis, MO) according to the manufacturer’s protocol. Briefly, T47D cells treated with hormones for 24 h were homogenized in ice-cold assay buffer, diluted within linear range of the assay, and colorimetric absorbance at 570 nm measured in triplicate. Results are representative of at least 2 experiments.
Statistical analyses
Statistics were performed using GraphPad Prism 8.3.0 (GraphPad Software, San Diego, CA), with the exception of metabolomics data, which was analyzed using MetaboAnalyst (see Metabolomics section for details). Two-tailed Student’s t-tests, one-way ANOVA followed by Tukey multiple comparison tests were used to compare groups where noted. For comparisons with unequal variance, data were log-transformed prior to one-way ANOVA testing. Significance at P < 0.05 is indicated in figures and legends.
Supplemental Materials
Supplemental materials are available at Figshare online data repository: https://dx.doi.org/10.6084/m9.figshare.13073390