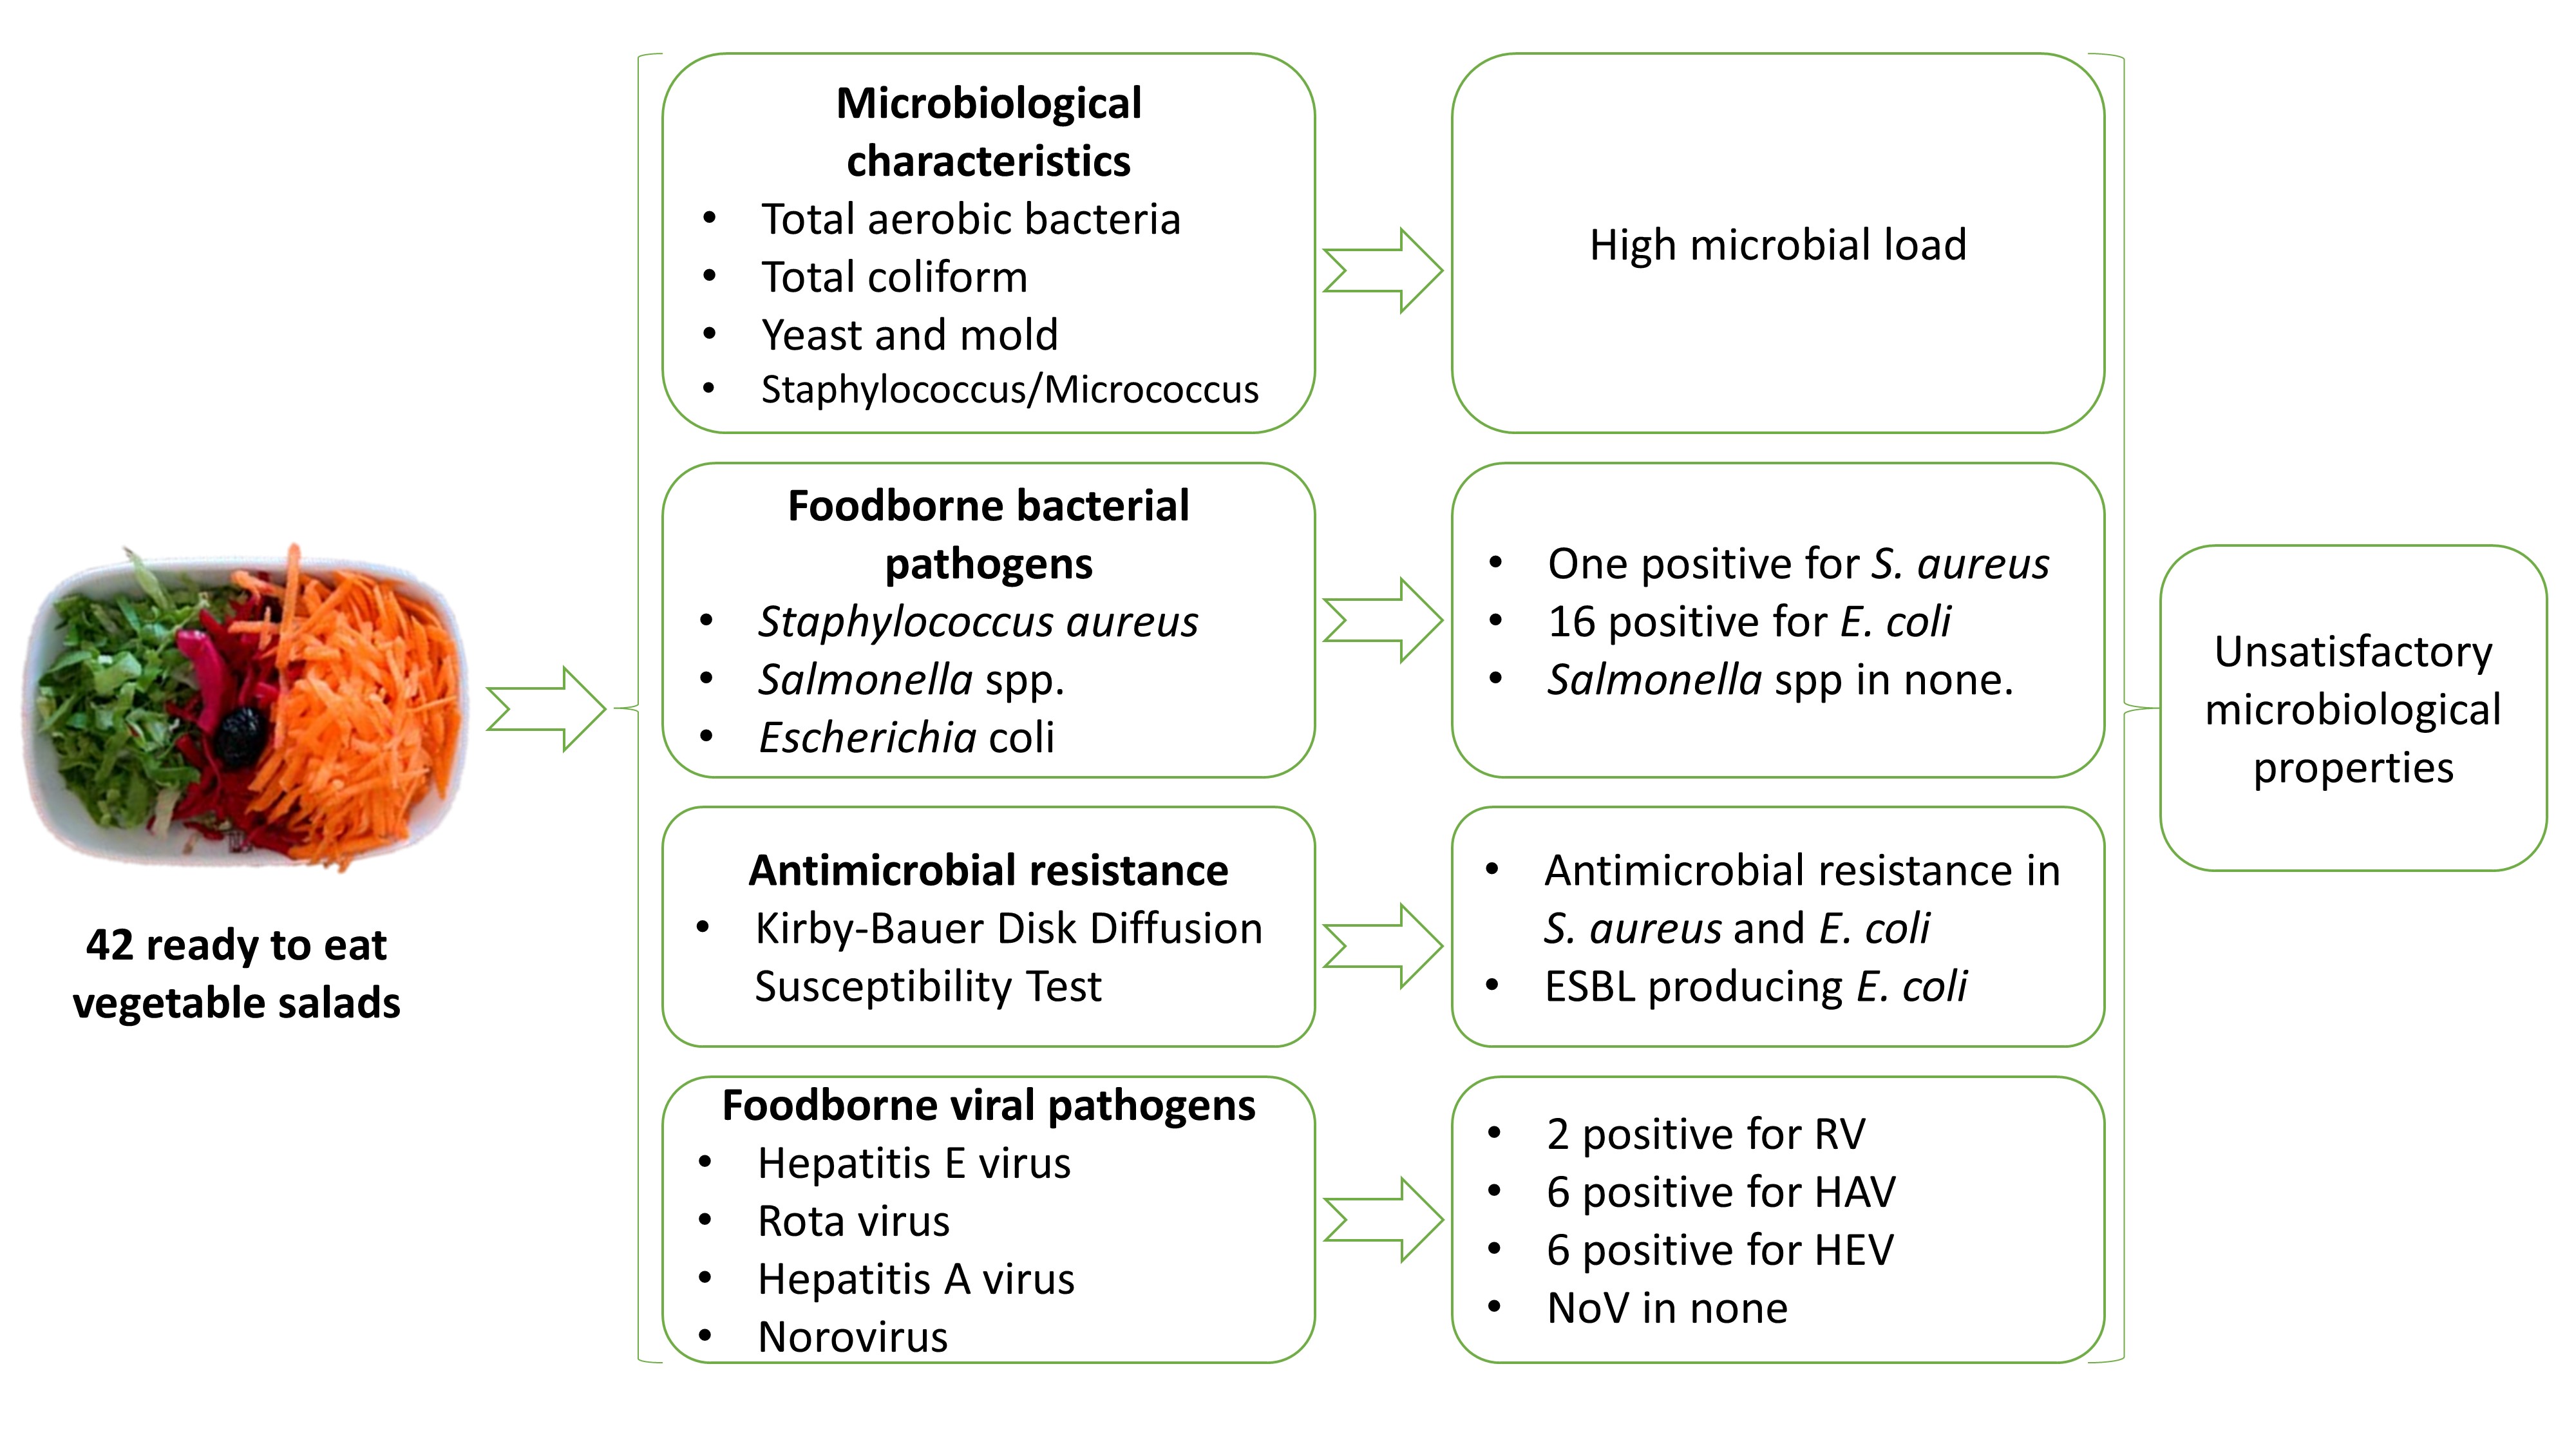
Of a total of forty-two REVS samples were collected from meat restaurants operating in the Erzurum region in eastern Turkey to investigate the foodborne pathogens including bacteria and viruses for their microbiological properties and antimicrobial resistance. The total aerobic bacteria (TAB) in the tested salads ranged from < 1 to 6.40 log CFU g− 1 (with an average of 4.72 log CFU g− 1) (Table 4). Although the lowest TAB count was detected in the samples #E14 and #E16, the highest value was in the #24 (Table 4). In addition, the highest yeasts and molds (5.00 log CFU g− 1), coliform (5.79 log CFU g− 1), and staphylococcal/micrococcal bacteria (5.66 log CFU g− 1) have been also detected in the sample #24. The count of bacteria in the salad samples tested in this study results showed an overall similar trend to each other. For example, when the TAB count was detected as high, other parameters showed a high trend as much as TAB (Table 4). A very few of the samples 3 out of 42 (7.14%) had a TAB count > 6 log CFU g− 1, which categorizes them as borderline, according to Health Protection Agency (HPA) guidelines (Gilbert et al., 2000). It has been reported that TAB was ranged from 4.1 log cfu/g to 8.3 log cfu/g in mixed fresh-cut salads in Mashhad, Iran (Najafi et al. (2012), however, it was between 5.12 and 9.75 log CFU g− 1 (with an average of 7.73 log CFU g− 1) in REVS in Cyprus (Xylia et al., 2019). In addition, a high level of TAB (6.43 log CFU g− 1-mean (3.50–8.39)) was reported in raw salad vegetables sold in Lebanon (Faour-Klingbeil et al., 2016). Of note, these findings were found to be considerably higher than our study. On the other hand, the presence of high numbers of yeast and molds (ranged between < 1-6.26 log CFU g− 1) determined in the REVS samples in the current study. In the previous studies, which were consistent with the current study results, the yeast and mold were reported 104-107 log CFU g− 1 and 1.63 and 6.68 log CFU g− 1 from India and Mexica, respectively (Pingulkar et al. (2001) In this context, coliform bacteria (CO) were detected at levels ranging from < 1-5.82 log CFU g− 1 in all REVS samples. Regardless of the sources, the number of CO was detected in all salads served in Mexican restaurants with limits ranging from 5.4×10³ to 1.7×10⁸ log CFU g− 1 1 (Gómez-Aldapa et al., 2013). The high coliform bacteria count identified in the current study may be associated with poor hygiene practices during the preparation of REVS. Apart from CO, the Staphylococcus and Micrococcus spp. count (STA/MICR) was determined between < 1 and 5.66 log CFU g− 1 in the current study, indicating a possible transmission of the food handlers. Risk factors that play a role in the contamination of vegetables, such as unsafe water sources for irrigation, inappropriate fertilizers or manures, access to livestock wild animals in the field, and unhygienic post-harvest handling (unhygienic utensil, labor, handling, packaging material, and improper/inadequate storage conditions) were indicated by investigators in the previous studies (Chau et al., 2017; Mercanoglu Taban and Halkman, 2011; Mir et al., 2018; Rahman et al., 2021). These results showed a relatively high contamination rate detected in the salad samples tested in this study, indicating that RTE salad serving in the meat restaurant is a risk factor for the transmission of food-borne diseases in humans (Bautista-De León et al., 2013).
Table 4
Microbiological quality of REVS
| | Microbial Count (log CFU g− 1) | Presence (+/-) |
| Symbol | TAB | YM | CO | STA/MICR | STA | SAL | EC | HEV | RV | HEA | NoV |
| E1 | 4.60 | 3.30 | 3.83 | 1.30 | - | - | + | - | - | - | - |
| E2 | 4.48 | 3.53 | 2.48 | 1.85 | - | - | - | - | - | - | - |
| E3 | 5.51 | 6.26 | 5.06 | 1.30 | - | - | - | - | - | - | - |
| E4 | 4.78 | 4.23 | 4.65 | 1.48 | - | - | + | - | - | - | - |
| E5 | 4.90 | 5.06 | 4.40 | 2.20 | - | - | + | - | - | - | - |
| E6 | 5.20 | 5.43 | 5.25 | 1.00 | - | - | + | - | - | - | - |
| E7 | 5.04 | 4.46 | 4.74 | 1.30 | - | - | - | - | - | - | - |
| E8 | 5.97 | 5.45 | 4.88 | 1.30 | - | - | - | - | - | - | - |
| E9 | 5.45 | 5.08 | 5.03 | 1.00 | - | - | - | - | - | + | - |
| E10 | 5.00 | 4.88 | 4.83 | 1.48 | - | - | - | - | - | - | - |
| E11 | 4.81 | 3.18 | 4.46 | < 1 | - | - | - | + | - | - | - |
| E12 | 5.81 | 5.59 | 5.46 | 1.70 | - | - | - | - | - | - | - |
| E13 | 4.90 | 4.86 | 4.89 | 1.30 | - | - | - | - | - | - | - |
| E14 | < 1 | 3.48 | 3.70 | < 1 | - | - | + | - | - | - | - |
| E15 | 5.00 | 5.09 | 5.06 | 1.48 | - | - | - | - | - | - | - |
| E16 | < 1 | 3.00 | < 1 | < 1 | - | - | + | - | - | - | - |
| E17 | 6.34 | 5.34 | 5.82 | 2.81 | - | - | - | - | - | - | - |
| E18 | 4.00 | 4.82 | 4.11 | 1.48 | - | - | + | - | - | - | - |
| E19 | 4.00 | < 1 | 3.30 | < 1 | - | - | - | - | - | - | - |
| E20 | 4.48 | 3.70 | 3.60 | 2.64 | - | - | - | - | - | - | - |
| E21 | 4.60 | 5.05 | 4.00 | 2.51 | - | - | + | - | + | + | - |
| E22 | 5.81 | 5.09 | 4.58 | 2.82 | - | - | + | - | - | - | - |
| E23 | 4.00 | 3.48 | 3.78 | < 1 | - | - | - | - | - | - | - |
| E24 | 6.40 | 5.00 | 5.79 | 5.66 | - | - | + | - | - | + | - |
| E25 | 4.30 | 4.40 | 3.78 | < 1 | - | - | - | - | - | - | - |
| E26 | 4.60 | 3.90 | 4.78 | 2.04 | - | - | - | - | - | - | - |
| E27 | 5.20 | 3.60 | 4.98 | 2.04 | - | - | - | - | - | - | - |
| E28 | 5.32 | 5.00 | 4.68 | 1.90 | - | - | - | - | - | - | - |
| E29 | 4.30 | 4.00 | 4.20 | < 1 | - | - | - | - | - | - | - |
| E30 | 4.70 | 3.48 | 4.38 | 2.92 | - | - | - | - | - | + | - |
| E31 | 4.30 | 4.58 | 3.78 | 1.70 | - | - | + | - | - | - | - |
| E32 | 5.76 | 4.54 | 4.68 | < 1 | - | - | - | - | - | - | - |
| E33 | 4.00 | 3.30 | 3.60 | 1.00 | - | - | + | - | - | - | - |
| E34 | 4.00 | 4.11 | 5.10 | 1.78 | - | - | + | - | - | - | - |
| E35 | 5.15 | 3.60 | 4.93 | 2.00 | - | - | - | - | - | + | - |
| E36 | 5.04 | 4.61 | 4.67 | 1.60 | - | - | - | - | - | - | - |
| E37 | 5.11 | 4.57 | 4.80 | 2.92 | - | - | - | + | - | - | - |
| E38 | 4.78 | 3.48 | 4.40 | 2.53 | - | - | - | - | - | - | - |
| E39 | 6.39 | 4.11 | 4.00 | 1.70 | - | - | + | + | - | + | - |
| E40 | 4.95 | 4.08 | 4.78 | 2.38 | + | - | - | + | - | - | - |
| E41 | 4.95 | 4.30 | 4.80 | 2.23 | - | - | + | + | - | - | - |
| E42 | 4.30 | 4.23 | 4.08 | 2.70 | - | - | + | + | + | - | - |
| MinV | < 1 | < 1 | < 1 | < 1 | | | | |
| MaxV | 6.40 | 6.26 | 5.82 | 5.66 | | | | |
| Variance | 1.56 | 1.04 | 0.93 | 1.25 | | | | |
| SD | 1.25 | 1.02 | 0.96 | 1.12 | | | | |
| SE | 0.19 | 0.16 | 0.15 | 0.17 | | | | |
| Mean | 4.72 | 4.27 | 4.38 | 1.62 | | | | |
Table 5
Antibiotic susceptibility pattern (Sensitive and Resistance) of E. coli isolates.
| Antibiotic (µg) | Antibiotic susceptibility pattern |
| Sensitive | Resistance |
| Meropenem (10 µg) | 16 (100%) | 0 |
| Chloramphenicol (30 µg) | 15 (93.75%) | 1 (6.25%) |
| Gentamicin (10 µg) | 0 | 16 (100%) |
| Kanamycin (30 µg) | 0 | 16 (100%) |
| Tetracycline (30 µg) | 13 (81.25%) | 3 (18.75%) |
| Ciprofloxacin (5 µg) | 12 (75.00%) | 4 (25.00%) |
| Sulfamethoxazole/Trimethoprim (25 µg) | 11 (68.75%) | 5 (31.25%) |
| Cefepime (30 µg) | 14 (87.5%) | 2 (12.50%) |
| Cefpodoxime (10 µg) | 9 (56.25%) | 7 (43.75%) |
| Cefoxitin (30 µg) | 12 (75.00%) | 4 (25.00%) |
| Aztreonam (30 µg) | 15 (93.75%) | 1 (6.25) |
Although the HPA guidelines indicated ≥ 102 for E. coli, ≥104 for S. aureus, and presence in 25 g for Salmonella spp. are evaluated as an unsatisfactory product (Gilbert et al., 2000), Turkish Food Codex (2011) has ruled that RTE foods should not be contained E. coli (< 101), Salmonella spp., L. monocytogenes, and staphylococcal enterotoxins. None of the REVS tested in this study contained Salmonella spp., whereas E. coli and S. aureus were isolated in 38.1% (16/42) and 2.4% (1/42), respectively, however, not using the colony counting method. Hence, it is impossible to evaluate the current study results according to HPA guidelines and/or the Turkish Food Codex.
Considered by food vendors as an indicator of fecal contamination and improper hygiene practices, E. coli can cause gastroenteritis and diarrhea in humans when taken with contaminated food (Abakari et al., 2018). The prevalence of E. coli was found to be 38.10% (16/32) in the salad samples analyzed in this study. This result was lower than in studies done in other countries: 96.7% in Ghana (Abakari et al., 2018); 94% in Cote d'ivoire (Coulibaly-Kalpy et al., 2017); 83.2% in Mexico (Gómez-Aldapa et al., 2013); 64% in Argentina (Pellicer et al., 2002). But it was higher than some countries: 20% in United Arab Emirates (Almualla et al., 2010) and 16.7% in Spain. The prevalence of E. coli contamination has displayed a significant variation between developed and developing countries (Rahman et al., 2021). For example, studies in low-income countries such as Pakistan, Bangladesh, and India reported the prevalence of E. coli in raw vegetable samples sold in retail markets ranged from 34–60% (Ahmed et al., 2019; Saksena et al., 2020; Shah et al., 2015) whereas it was 3.1% and 4.1% in the USA and Germany, respectively (Liu and Kilonzo-Nthenge, 2017; Schwaiger et al., 2011). Phylo-typing of E. coli strains using quadruplex PCR displayed six isolates in group A, four isolates in groups B1 and C, and one isolate in groups E and F (Table 6). Although most of E. coli isolates were detected in the group with commensal strains (group A and B1) in the current study, only one isolate was detected in the virulent group (F).
Table 6
Phylogenetic groups and ESBL presence of E. coli isolates from RTE vegetable salad samples
| | Isolate ID | Phylogeny | ESBL | ESBL Genotype |
| | E1 | B1 | - | |
| | E4 | B1 | - |
| | E5 | A | - |
| | E6 | B1 | - |
| | E14 | A | - |
| | E16 | B1 | + | CTX-M-1, TEM |
| | E18 | C | - | |
| | E21 | A | - |
| | E22 | A | - |
| | E24 | C | + | - |
| | E31 | C | - | |
| | E33 | A | - |
| | E34 | A | + | CTXM8/25 |
| | E39 | E | + | - |
| | E41 | C | + | TEM |
| | E42 | F | + | - |
| Total | 16/42 | | 6/16 | |
Despite the high STA/MICR count, S. aureus could only be detected in one sample in the current study. As it is known, S. aureus is one of the most important foodborne pathogens worldwide, some strains of which can produce one or more toxins, mainly enterotoxin (Xing et al., 2014). The prevalence of S. aureus in REVS observed in the present study is comparable to similar studies (Faour-Klingbeil et al., 2016; Najafi et al., 2012; Seo et al., 2010).
The sources of contamination of Salmonella could be animal feces as fertilizer, cultivation of the plants with wastewater, and personal hygiene (Machado et al., 2006; Salleh et al., 2003; Sapkota et al., 2019; Taban et al., 2013). Salmonella spp. was also isolated in fresh vegetables by investigators in the previous studies (Evelyne et al., 2022; Sapkota et al., 2019; Yang et al., 2020) in contrast to our study findings. On the other hand, in line with our current study, Campos et al. (2013) reported that they did not detect Salmonella spp. in 45 REVS sold in Portugal.
Only one S. aureus was isolated and confirmed by PCR (with femA gene) in the current study, and the isolate was resistant to gentamicin, kanamycin, aztreonam, and ciprofloxacin in the disc diffusion assay. In addition, the PCR analysis conducted for detection of the mecA gene showed that the S. aureus strain isolated in the current study was not harboring the mecA gene. On the other hand, all E. coli strains (n = 16) were resistant (100%) against aminoglycoside antibiotics (gentamicin and kanamycin) tested in this study, even though they were susceptible to meropenem in the disc diffusion assay. The isolates displayed a low level of resistance against chloramphenicol (6.25%), tetracycline (18.75%), and ciprofloxacin (25.00%). These data indicated that antimicrobial-resistant E. coli strains from REVS salad samples in the current study still remain moderately low-level resistant to anti-Gram-negative drugs of importance for human medicine, suggesting that these antibiotics could be non-effective in the future due to the rising antimicrobial resistance. The double-disc synergy test used for the detection of the phenotypic resistant ESBL producing strains in the current study displayed that 35.7% (6/16) of the isolates were ESBL producing. Molecular analysis of ESBL producing strains showed that one strain harbored two different genes (blaCTXM−1 and blaTEM), whereas two isolates carried one gene (blaTEM and blaCTXM8/25). To the best of our knowledge, this is the first report of the presence of ESBL producing E. coli in REVS in Turkey. The outbreaks due to the multi-drug resistant bacteria on fresh vegetable products have been reported around the world by researchers in previous studies (Freitag et al., 2018; Janalíková et al., 2018; Liu and Kilonzo-Nthenge, 2017; Sapkota et al., 2019). A study in Japan indicated that fresh vegetables served as an important route of transmission of ESBL producer bacteria to humans (Usui et al., 2019). In terms of public health, antimicrobial resistant zoonotic pathogens in foods pose a direct risk. Foods can be contaminated with bacteria harboring antimicrobial resistance genes, antibiotics using agricultural production, resistance genes of microorganisms used as starters during food processing, and cross contamination. Since raw foods are consumed without undergoing any other processing, they carry a significant risk of transferring antimicrobial resistance to humans. Ultimately, transfer of antimicrobial resistance genes between bacteria can also occur after ingestion by humans (Verraes et al., 2013). Moreover, poor processing and preservation conditions lead to the continued presence of damaged or stressed cells in food, increasing the risk of bacteria carrying antimicrobial resistance genes transmission (Lammie and Hughes, 2016).
The presence of hepatitis E virus (HEV), rotavirus (RV), hepatitis A virus (HAV), and norovirus (NoV) was investigated in the current study to reveal important viral infections to public health in the REVS samples. Viral nucleic acid was detected in fourteen salad samples tested in the current study by PCR. Of these, two were evaluated as positive for RV (4.8%), and six for HAV (14.3%) and HEV (14.3%). Nov couldn’t be found in any of the samples in the current study. Gel-electrophorese images of viral nucleic acids and control groups determined positive by PCR analysis are given in Fig. 1. HEV, HAV, RV, and NoV are transmitted to humans by food and environmental routes depending on the virus genotype, environmental conditions, hygienic conditions, and the types of food consumed (Van der Poel, 2014). In a study showed that in the total of 911 REVS samples including mixed salads, carrots, valerian arugula, spinach, iceberg, and romaine lettuce from supermarkets in Italy, the total prevalence of HAV and HEV was 1.9% (18/911) and 0.6% (6/911), respectively, even though NoV could not be detected in any of the samples (Terio et al., 2017). Although the prevalence of HAV and HEV was detected high level, similarly NoV did not determine in the samples tested in the current study. In contrast to our study data, a low level of NoV (2.90–3.75%) was reported in vegetables and fruits by the other researchers in published studies (Parada-Fabián et al., 2016), indicating the less frequent detection of NoV in REVS products. Hence, salads are less frequently involved in foodborne viral outbreaks than other foods; however, they may be contaminated with unsanitary food workers or raw materials that have been contaminated (Cheng et al., 2018). Khan et al. (2014) reported that 29 samples including cauliflower, tomato, ridge gourd, brinjal, pumpkin, mint, bitter gourd, okra, pepper, cucumber collected from 13 different locations of district Mardan in Pakistan, 1 were positive for HAV. Shin et al. (2019)) reported that 1 sample were positive for HAV in fresh vegetables and fruits including Chinese cabbage, cucumber, lettuce, strawberry. Fresh and frozen vegetable and fruit samples including spinach, parsley, purslane, cherry and strawberry from supermarkets in Mexico, 7/80 were positive for HAV (Parada-Fabián et al. 2016). In another study, of the 70 vegetable samples including 51 first range raw vegetables and one fourth range REVS from markets in Sicily, 1.4% for HEV((Purpari et al., 2019)). The prevalence of RV was found variable in vegetables: 13.75% (11/80) in Mexico (Parada-Fabián et al. 2016); 22% (23/101) in Argentina (Emilse et al. 2021). To the best of our knowledge, this is the first report from Turkey for HEV, HAV, and RV positivity in REVS, suggesting REVS can be a reservoir for the important viral pathogens and to be considered before consumption.
Viral contamination can occur at several points in the food production chain. Because they do not have a chance to growth outside of living cells, their presence in food can be explained by pre-harvest contamination of vegetables or post-harvest contamination from food processors. On the other hand, the fact that the food handlers in the field where the vegetables are harvested and the water quality used in agricultural irrigation can affect the microbiological properties of vegetables can also explain the high level of viral contamination (Terio et al., 2017).