Synthesis and characterization of UCNPs
UCNPs luminescence is a complex multi-photon energy transfer and conversion process. UCNPs have strong emission peaks in the UV, visible, and near-infrared bands under 980 nm light excitation, and the overall visible performance is blue. 345 nm and 362 nm UV light originates from 1I6 to 3F4 energy level jump and 1D2 to 3H6 energy level jump, respectively. In the visible band, the purple band at 450 nm originates from the 1D2 to 3F4 energy transition, the blue band at 477 nm originates from the 1G4 to 3H6 energy transition, and the red band at 645 nm originates from the 1G4 to 3F4 energy transition. In the near-infrared band, the near-infrared light at 802 nm originates from the energy level jump from 3H4 to 3H6, and the doping ratio of UCNPs is NaYF4: 20% Yb3+,0.5% Tm3+@NaYF4:10% Yb3+, the schematic diagram of the energy level diagram for the Yb3+ and Tm3+ ions and the fluorescence spectra are shown in Fig. 1A and Fig. 1B.
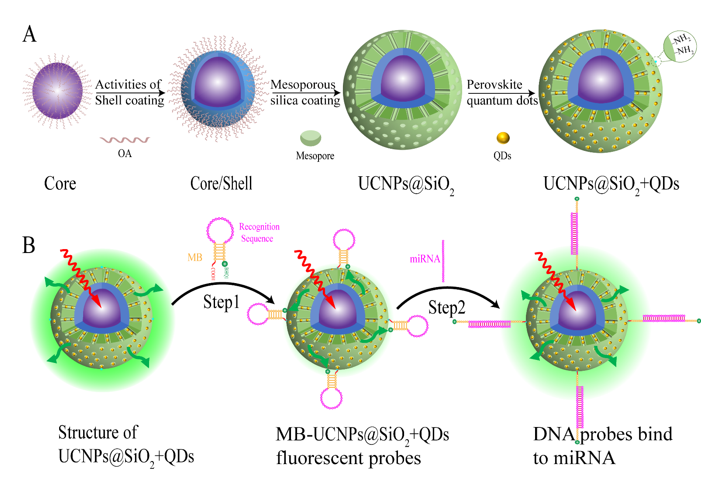
The typical high-temperature coprecipitation method was used to prepare UCNPs luminescent nanomaterials [39, 40]. The TEM image of UCNPs is shown in Fig. 1C. UCNPs nanomaterials have an overall structure of hexagonal terms and can be well dispersed, the high-resolution TEM image of individual nanoparticles clearly shows the lattice stripes with a spacing of 0.54 nm, and the average structure size of UCNPs is 32.3 nm. The surface of UCNPs is surrounded by a large amount of hydrophobic oleic acid, in order to make the UCNPs nanoparticles biocompatible and water soluble, a typical stober method was used to prepare mesoporous silica [41, 42], with UCNPs as the core and a structure-directing agent CTAB to prepare mesoporous silica wrapped around the conversion structure, which has a very high specific surface area, strong adsorption, and good stability performance. The TEM image of UCNPs@SiO2 is shown in Fig. 1D, it can be seen that there are many small white holes and white stripes, the particles are relatively transparent, and the size of the overall structure of UCNPs@SiO2 is 97 nm, at this time, the luminescence intensity is reduced due to the thickness of the encapsulated silica, the light intensity of UCNPs@SiO2 decays to 77% of the structure of UCNPs, and it still maintains a good overall luminescence performance to accomplish the subsequent application.
Synthesis and characterization of QDs
A typical thermal injection method was used to prepare QDs [43, 44], and the XRD patterns of QDs are shown in Fig. 2A, compared with the standard card of CsPbBr 3(JCPDS NO 54.0752) for analysis, the diffraction peaks obtained have a good match between the crystalline spacing and relative intensity with the position of the standard card peaks, and there are no other obvious spurious peaks, apart from the diffraction peaks of other QDs. The position change of the diffraction peaks of the other QDs is related to the doping of halogen elements, due to the atomic radius DCl−<DBr−<DI−, the position of the XRD diffraction peaks is shifted to the left as a whole after the replacement of the smaller atomic radius by the larger atomic radius in the same crystal in the halogen elements. The TEM image of QDs is shown in Fig. 2B, and it shows a tetragonal term structure with good dispersion and the average size of QDs is 11 nm.
The absorption spectra of QDs are shown in Fig. 2C. From element Cl− to element Br− and then element I−, the absorption peak position is also shifting to red, and there is a smaller absorption peak position before the corresponding wavelength emission position. Furthermore, all of them have strong absorption in the small wavelength range which indicates that QDs can absorb generally. The fluorescence spectra of QDs are shown in Fig. 2D, the doping ratio of different halogen elements (X = Cl, Br, I) can achieve continuous modulation in the full wavelength range of 400nm-700nm, and QDs have a very narrow half-peak width of 12nm-37nm, it shows that QDs have good monochromatic properties and can achieve high fluorescence purity, which can be widely applied in various fields by taking advantage of the enormous unique advantages of QDs.
Synthesis and characterization of UCNPs@SiO2 + QDs
In order to ensure that the nanoparticles have good biocompatibility and hydrophilicity, UCNPs were used as the core and mesoporous SiO2 was used to wrap around the UCNPs. The XRD patterns of UCNPs@SiO2 are shown in Fig. 3A, which compared with the standard card of NaYF4 (JCPDS NO 16.0334). The positions of diffraction peaks correspond to each other, and they did not have an observable change before and after wrapping. There is a broader diffraction peak at the position of 22\(^\circ\), which was due to the factor of amorphous silicon. The high resolution diffraction peaks of UCNPs@SiO2 + QDs were obtained after the adsorption of QDs on the mesopores and surface of SiO2. The basic diffraction peak position did not change significantly, and the diffraction peaks of QDs were increased, yet the peak magnitude was relatively weakened, with no other obvious spurious peaks. The TEM image of UCNPs@SiO2 + QDs is shown in Fig. 3B, and it is evident that the QDs are attached to the surface of the UCNPs@SiO2 + QDs composite material. The high-resolution TEM image of a single nanoparticle clearly shows the lattice stripe with a d-spacing of 0.28 nm in the (200) plane, indicating the successful intervention and adsorption of QDs in the mesoporous SiO2.
To indicate whether QDs intervene in the mesopores of SiO2, the specific surface area BET (Brunauer-Emmet-Teller) was used to comparatively analyze the changes in surface adsorption capacity and pore number before and after the addition of quantum dot QDs in UCNPs@SiO2. N2 isothermal adsorption and desorption curves are shown in Fig. 3C, when P/P0 was larger than 0.28, the adsorption amount started to increase slowly, and the adsorption rate had been kept steady. This indicates that the pore channel homogeneity was well and the pore size was small. The BET specific surface area and the pore volume of UCNPs@SiO2 were measured to be 935.264m2g− 1 and 1.116cm3/g− 1. After adding QDs with UCNPs@SiO2, the BET specific surface area and the pore volume of UCNPs@SiO2 + QDs were measured to be 764.707 m2g− 1 and 0.925 cm3g− 1. The specific surface area and pore volume were significantly decreased due to the entry of QDs into the mesopores and their adsorption on the surface. The number of pores on the surface was also measured to be reduced, with a significant reduction at the 2.6 nm position, and these changes could provide a strong piece of evidence for the entry of QDs into the small-sized mesopores of UCNPs@SiO2. The EDS energy spectra of the UCNPs@SiO2 + QDs is shown in Fig. 3D. From the image, it can be seen that the new elements of Si, Cs, Pb, and Br are added to the elemental distribution of UCNPs, which indicates the presence of SiO2 and QDs on the surface of UCNPs.
Fluorescence properties of UCNPs@SiO2 + QDs
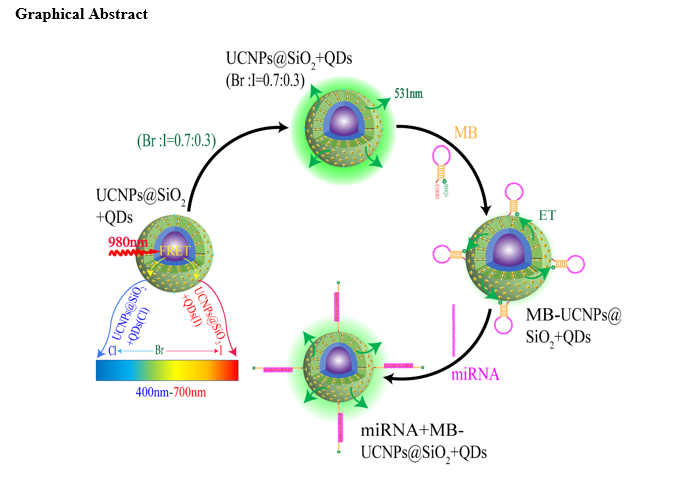
As an example, the absorption spectra of QDs (Br:I = 0.7:0.3) were used to analyze the luminescence mechanism of UCNPs@SiO2 + QDs. The fluorescence spectra of UCNPs@SiO2 and the absorption spectra of QDs (Br:I = 0.7:0.3) are shown in Fig. 4A. The emission peaks of UCNPs@SiO2 at 345 nm, 362 nm, 450 nm, and 477 nm position of the emission peaks overlap with the strong absorption range of QDs, which makes QDs multi-photon absorption of the luminescence of UCNPs@SiO2. Under the excitation of 980 nm near-infrared light, the FRET occurs between both UCNPs and QDs, and the multi-emission light of UCNPs excited the luminescence of QDs again synergistically, with QDs doping in UCNPs@SiO2 + QDs. The fluorescence spectra of different halogen element ratios are shown in Fig. 4B. The QDs with the size of 11 nm is slightly smaller than the corresponding Bohr exciton diameter of 12 nm, due to the band gap and quantum confinement effect of QDs proper [45, 46], which makes the QDs emission peak appear to have a blue shift phenomenon, and the position of blue shift occurs at about 10 nm, and this phenomenon exists for all the other composite materials. The fluorescence chromatogram corresponding to the whole emission peak is shown in Fig. 4C, and any fluorescence color in the visible wavelength band can be obtained, realizing the panchromatic emission at wavelengths beyond the availability of lanthanide elements. Under the excitation of near-infrared light, the halogen element doping ratio and size effect of QDs can be used to control the luminescence position of UCNPs@SiO2 + QDs composites continuously in the full wavelength range of 400nm-700nm, which can be accurately modulated to the best luminescence peak position for detecting the target, so as to enhance the practical application efficiency of UCNPs@SiO2 + QDs composite material.
To illustrate the process of the change of the composite surface structure more clearly, the FTIR spectra of UCNPs@SiO2 + QDs are shown in Fig. 4D. The surface of the UCNPs was accompanied by a large amount of oleic acid, and the absorption peaks at 2931 cm− 1 and 2858 cm− 1 were derived from the stretching vibration of the C-H bond of the surface oleic acid ligand. The absorption peak at 1049 cm− 1 corresponded to the stretching and bending vibrations of Si-O-C. In addition, the absorption peak at 1125 cm− 1 was due to the bending vibrations of Si-O-Si, which indicated that SiO2 has been successfully encapsulated on the surface of the upconverted UCNPs. The vibrational peak at the 1610 cm− 1 position was the bending vibration of Pb-X3 in QDs owing to the removal of structure-directing. The absorption peaks at 1543 cm− 1 and 1654 cm− 1 corresponding to the N-H bending vibrations were significantly weaker after the removal of the structure-directing agent (CTAB). Using the trace hydrolysis of APTES for amination on the surface of UCNPs@SiO2 + QDs, the weak absorption band at 946 cm− 1 was Si-OH stretching, and it indicated that APTES underwent hydrolytic condensation, which further demonstrated that amination was achieved on its surface and obtained the aminated UCNPs@SiO2 + QDs composite material.
Characterization of UCNPs@SiO2 + QDs (Br:I = 0.7:0.3)
In order to improve miRNA detection, we combined UCNPs@SiO2 with QDs (Br: I = 0.7: 0.3). Figure 5A showed the fluorescence spectrum of UCNPs@SiO2 + QDs (Br: I = 0.7: 0.3) and the absorption spectrum of MB-BHQ1. The emission peak of UCNPS@SiO2 + QDs at 531nm overlaps with the strong absorption peak. The emission peak overlaps with the position of the strong absorption peak of BHQ1 on the molecular beacon, which could achieve the best quenching effect on the luminescence of UCNPs@SiO2 + QDs at 531 nm. The detection of UCNPs@SiO2 + QDs (Br:I = 0.7:0.3) and the BHQ1 quenching group was designed by connecting the two sides of MB, according to the fluorescence intensity at the 531 nm position to complete the detection of miRNA-155.
To achieve the best conversion efficiency of both UCNPs@SiO2 and QDs (Br:I = 0.7:0.3), UCNPs@SiO2 was combined with various concentrations of QDs (Br:I = 0.7:0.3) to obtain the various graphs of UCNPs@SiO2 + QDs at each peak value, as shown in Fig. 5B. As the concentration of QDs in UCNPs@SiO2 + QDs increases, the light intensity at the 531 nm position is gradually increased, mainly at the sacrifice of UV and blue light, and the UV intensity at 345 nm and 362 nm decreases much faster than the blue emission intensity at 450 nm and 477 nm, while the red emission at 645 nm is nearly changeless. This may be attributed to the much larger absorbance of QDs in the UV than in the blue and almost no absorption in the red, it is shown in Fig. 5C. In order to ensure the structural stability of UCNPs@SiO2 + QDs and to maintain the strong luminescence intensity of UCNPs@SiO2 + QDs at 531 nm, QDs (Br:I = 0.7:0.3) at a concentration of 0.3 mg/ml is chosen as the best level, and the FRET efficiency of both of them is obtained up to 70.6%. It can be shown that there is a high energy conversion efficiency between UCNPs and QDs.
Fluorescence properties of MB-UCNPs@SiO2 + QDs
MB was directly attached to the surface of UCNPs@SiO2 + QDs via a chemical bond, which allowed the BHQ1 quenching group to be close to the surface of the material, the 5' side of the MB chain was modified with COOH and the BHQ1 quenching group was modified at the 3' side, and the maximum distance between the surface of UCNPs@SiO2 + QDs and the BHQ1 quenching group was 0.68 nm. (According to the length of one base pair), this distance was much smaller than the effective action distance of FRET at 10 nm, so it made the fluorescence quenching occur, the fluorescence quenching effect of MB-UCNPs@SiO2 + QDs fluorescent probe at the position of 531 nm was obtained, and the energy transfer efficiency was obtained to be 66.3%, which reduced the fluorescence background signal of the probe itself. The fluorescence characteristics of MB-UCNPs@SiO2 + QDs fluorescence probe sensing are shown in Fig. 6A, and the normalized fluorescence intensity is plotted in Fig. 6B.
When the fluorescent probe was linked to the neutral miRNA-155, the structural loop of the MB-155 was opened, causing the BHQ1 quenching group to move away from the surface of UCNPs@SiO2 + QDs. The maximum distance between the surface of UCNPs@SiO2 + QDs and the BHQ1 quenching group was calculated to be 11.9 nm. (According to the number of bases of MB length), which was greater than the effective action distance of FRET at 10 nm. This made the partial fluorescence of UCNPs@SiO2 + QDs at the 531 nm position recovered, and the efficiency of energy transfer at this time was obtained to be 35.6%. It did not complete recovery, probably because there was still a partial fluorescence burst mechanism of energy radiative transfer, and the UCNPs@SiO2 + QDs released the excitation energy in the form of radiation and returned to the ground state itself.
Optimization of fluorescent probes MB-UCNPs@SiO2 + QDs
To optimize the preparation of fluorescent probes MB-UCNPs@SiO2 + QDs, fluorescent probes were prepared based on the same volume of 1ml aminosylated UCNPs@SiO2 + QDs using different concentrations (0.05, 0.1, 0.2, 0.4, 0.8 and 1 µM) of MB solution, and the fluorescence detection of the probes was performed. The fluorescent spectra is shown in Fig. 7A. Figure 7B depicted the change curve of fluorescence intensity at 531 nm as MB concentration increased, and when the concentration of MB increased to 1 µM, the light intensity was basically stable and remained unchanged, indicating that the fluorescence had been quenched to the maximum extent. Thus the optimal concentration of MB was 1 µM, and this concentration of MB-155 fluorescence was used.
Detection of miRNA-155 with fluorescent probe MB-UCNPs@SiO2 + QDs
Equal volumes of 20 µL of miRNA-155 solutions with different concentrations (100 pM, 1 nM, 10 nM, 100 nM, 1 µM, and 10 µM) were prepared and connected to the fluorescent probe MB-UCNPs@SiO2 + QDs, which as shown in Fig. 8A. The relationship between the logarithm of miRNA-155 concentration (logCmiRNA-155) and the fluorescence intensity ratio (F/F0) was plotted in Fig. 8B, with F0 represented the fluorescence intensity of MB-UCNPs@SiO2 + QDs and F represented the fluorescence intensity of miRNA-155 + MB-UCNPs@SiO2 + QDs, it could be observed that from 100 pM to 10 µM miRNA-155 concentration followed the linear fitting curve F/F0 = 0.15×logCmiRNA−155+2.67 (R2 = 0.99), according to the definition of the limit of detection (LOD) 3σ/ s the LOD of miRNA-155 was calculated to be 73.5 pM, here σ was the standard deviation of F/F0 and s was the linear equation of the slope.
To analyze the effect of fluorescent probes on the detection of specific recognition of different miRNAs, samples of miRNA-155 and three mismatched sequences were used for further experiments: normal miRNA-155 solution, miRNA solution with one mismatched base in miRNA-155 (M1-155), miRNA solution with two mismatched bases in miRNA-155 (M2-155), miRNA samples with the complete mismatched bases in MB-155 (UM-155). The base sequences of MB and miRNAs are shown in Table 1, and the mismatched bases marked in red are listed.
Table 1
Nucleotide sequences of miRNAs and MB in fluorescent probes.
| name | Sequences (5’-3’) |
| miRNA-155 | UUAAUGCUAAUCGUGAUAGGGGU |
| MB-155 | COOH-ATAGCGACCCCTATCACGATTAGCATTAACGCTAT-BHQ1 |
| M1-155 | UUAAGGCUAAUCGUGAUAGGGGU |
| M2-155 | UUAAGGCUAAUAGUGAUAGGGGU |
| UM-155 | AATTACGATTAGCACTATCCCCA |
| The same concentrations of targets with different base sequences were prepared and the fluorescence spectra were obtained as shown in Fig. 8C, and the fluorescence peaks of the four fluorescence spectra were plotted as bar graphs as shown in Fig. 8D. It could be observed that the degree of fluorescence recovery varies, with the largest fluorescence recovery signal for the normal miRNA-155 solution and the smallest fluorescence recovery signal for the complete mismatch. Which indicated that the prepared fluorescent probes have good specific recognition in the detection. Even a few single or individual mismatched bases on miRNA-155 can be detected, and it could specifically distinguish miRNA-155 from miRNA with mismatched sequences, which could provide a strong basis for the early diagnosis of diseases such as cancer and tumors. The performance of the constructed nanoprobes was compared with similarly reported UCNPs nanoprobes (Table 2). The detection limits of the established fluorescent probes were equal to or lower than the detection limits of other fluorescent probes. |
Table 2
Comparison of the performance of the established fluorescent probes and the reported similar fluorescent probes.
| Energy donor | Energy acceptor | Target | Linear range | Detection limit | Ref. |
| UCNPs | Cy3 | MiRNA-21 | 200pM-1.4nM | 95pM | [47] |
| UCNPs | BHQ3 | MiRNA-21 | 50-500nM | 2nM | [48] |
| UCNPs | TAMRA | DNA | 40-200nM | 2.8nM | [49] |
| UCNPs | MoS2 | MiRNA-155 | 50-500nM | 0.25nM | [50] |
| UCNPs,QDs | BHQ1 | MiRNA-155 | 100pM-10µM | 73.5pM | This work |