Participants and Study Design
This intervention study was a 6-month, double-blind, randomized, placebo-controlled trial conducted at Hamad Medical Corporation (HMC) in Doha, Qatar. The research ethics board of HMC approved the protocol and the trial was registered at www.clinicaltrials.gov (no. NCT02098980). An informed consent was obtained from all participants at enrollment.
Men and women aged 18-75 of multicultural backgrounds were recruited via telephone calls and campaigns held at Qatar landmarks. A two-step process was used to screen for eligibility as shown in Figure 1. In the first step, screening 1, eligibility was based on a finger prick HbA1c result (5.6-6.4%) indicating pre-diabetes [22]. During the second screening (visit 0), eligibility was based on physical and biochemical measurements, which included medical history, prescribed medication, height, weight, waist circumference, BMI, pulse, fasting glucose, HbA1c, cholesterol, triglycerides, liver function, blood analyses, insulin, C-peptide, serum 25(OH) vitamin D3, parathyroid hormone (PTH) and calcium.
Inclusion criteria were as follows: non-pregnant or lactating women, BMI <40 kg/m2, serum 25(OH) vitamin D3 concentration <30 ng/ml, fasting serum glucose <7.0 mmol/L, HbA1c 5.6-6.4%. Subject inclusion also relied on the presence of one or more of the following: waist circumference of >80 cm for females and >90 cm for males [23], older than 40 years old, family history of diabetes in first-degree relative, previous history of gestational diabetes, history of high blood glucose or triglycerides and/or low HDL cholesterol. Participants were excluded if: fasting serum glucose ≥7.0mmol/L, had history of renal failure or liver disease, serum urea or creatinine >1.8 times the upper limit of normal (ULN), serum aspartate or alanine transaminase (AST, ALT) >1.5 times ULN, use of medicine to treat diabetes or which influenced glucose metabolism at the time of screening, experienced a medical or surgical event requiring hospitalization within 3 months of randomization, and if they suffered from any condition affecting nutrient absorption (e.g. irritable bowel syndrome).
At visit 1, study participants were randomly assigned either the placebo or the vitamin D treatment at a dose of 30,000IU/week (equivalent to 4,000IU per day) and were given supplements to cover a 3-month period. In this visit they completed the Finnish Diabetes Risk Score (FINDRISC) questionnaire [24], a 24-hour recall food questionnaire, signed the consent form, and underwent their baseline 75g OGTT (after overnight fast). All active participants visited the recruitment center two more times in 3-month intervals to complete 6 months of treatment and underwent the same physical and biochemical measurements as in visit 0 and 1.
Randomization
ID numbers were assigned to subjects sequentially in the order in which their eligibility was ascertained and informed consent obtained. Subjects were randomly assigned to one of the 2 treatments in blocks of varying sizes. To achieve this, a set of sealed, opaque envelopes labelled with the ID number and containing the pre-assigned treatment code were created and assigned to subjects in the order they attended for visit 1. Subjects were randomized to control or vitamin D group opening the next available envelope. Randomization (done using the “@RAND” function on a Lotus 123 spreadsheet) and creation of the sealed envelopes was done by the research team at the recruiting center and a list of ID numbers and coded treatment assignments were kept in a secure web-based database.
Biochemical Measurements
The primary outcome was to determine the change in 2hPCG from baseline to end-point following supplementation with vitamin D. Participants underwent an oral glucose tolerance test (OGTT) at two 3-month intervals to determine the change in plasma glucose concentration at 2 h after 75g OGTT (2hPCG). At each OGTT, plasma glucose was measured at four different time points, 30, 60, 90 and 120 minutes after glucose load. Secondary outcomes included lipid profile, glycated hemoglobin, fasting plasma glucose and insulin, post-prandial insulin, and insulin sensitivity derived from the Homeostatic Model of Assessment - Insulin Resistance (HOMA-IR) and Matsuda Index. B-cell function was measured by HOMA-β, disposition index (DI), insulinogenic index, and glucose and insulin area under the curve (AUC) from 0-120 minutes during OGTT at each time point (Baseline, 3 months, 6 months).
Serum glucose was measured using the hexokinase/G-6-PDH method (Abbott architect C systems analyzer). Chemiluminescence immunoassay (CLIA) technology (LIAISON Analyzer family) was used for the in vitro quantitative determination of insulin in human serum. Serum 25(OH) D were measured by the method of one-step immunoassay using Chemiluminescent Micro Particle Immunoassay (CMIA) technology (Abbott Architect iSystem analyzer).
Statistical Analysis
Data are presented as frequency (n, %) and means (± standard deviation, SD) and median (interquartile range, IQR) where appropriate. Paired t-test was used to test the within groups differences. For the non-parametric variables, we used the Wilcoxon signed rank test. Unpaired t-test was used to compare between two means of parametric continuous variables. Mann-Whitney U test was used to compare between two means of all non-parametric continuous variables. Primary outcomes were analyzed with ANCOVA using a general linear model with the change from baseline to endpoint for each outcome in both placebo and vitamin D groups adjusting for age, gender, baseline BMI and ethnicity. Bivariate associations were tested with Spearman rank correlation test to examine the strength of association between the differences (endpoint and baseline) of vitamin D. Multivariable linear regression models were implemented to test the association between primary and secondary outcomes and vitamin D difference between baseline and endpoint, after adjusting for the aforementioned confounding factors. Estimated associations were described with β-coefficients and 95% CI and R2. A p-value <0.05 was considered statistically significant. All statistical analyses were performed using SPSS Statistics 19 software (SPSS Inc, Chicago, IL, USA).
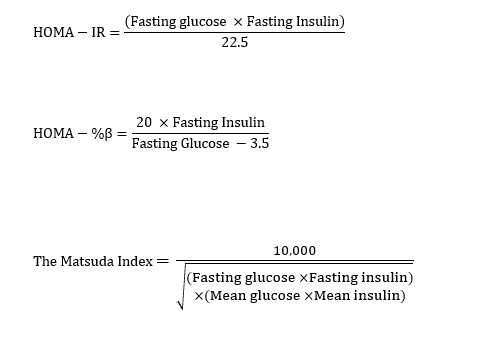
Assessment of insulin sensitivity and β-cell function were estimated by the Homeostasis Model of Assessment-Insulin Resistance Index (HOMA-IR), the Homeostatic Model of Assessment- Beta (HOMA- β) and the Matsuda index and were calculated as follow [25, 26]: (see Eq. 1 in Supplementary Files)
Additional calculations for β-cell function include the insulinogenic index and oral disposition index (DI). Insulinogenic index was calculated as the change in insulin divided by change in glucose from 0 to 30 minutes. Oral disposition index was calculated as the product of (1/fasting insulin) x Insulinogenic index. The area under curve (AUC) for plasma glucose and serum insulin was calculated with the use of the trapezoidal rule method 0-120 minutes (OGTT measurements) for each time point (baseline, 3 months and 6 months). Data were analyzed with repeated measures of ANOVA (no adjustment or interaction was used for this model).