A total of 603 individuals aged 5 to 88 years old (Median: 32; Interquartile range (IQR): 42) were examined in the six health areas of the Ndikinimeki Health District, organized into 12 clusters (communities). The sex ratio was slightly male-biased (50.9%).
Prevalence and intensity of O. volvulus infection
Of the 603 participants examined in the framework of this study, 42 (7.0%; 95% CI: 5.2–9.3) were found to be infected with O. volvulus. The prevalence of onchocerciasis was significantly higher in the Boutourou Health Area (21.6% (95% CI: 14.5–30.1) (Chi-square = 48.708; df = 5; p = 0.0001), among males (11.1%; 95% CI: 7.7–15.1) (Chi-square = 16.301; df = 1; p = 0.0001) and among younger adults (20–34 years old) (18.3%; 95% CI: 11.0-27.6) (Chi-square = 25.727; df = 3; p = 0.0001) (Table 1). At the community or cluster level, river blindness prevalence ranged between 23.7% (95% CI: 13.6–36.6), and was significantly higher in the communities Kiboum 1 (19.3%; 95% CI: 10.0-31.9) and Kiboum 2 (23.7%; 95% CI: 13.6–36.6) compared to the other communities (highest prevalence in Makénéné Town Water: 8.5%; 95% CI: 2.3–20.4) (Chi-square = 51.314; df = 11; p = 0.0001) (Fig. 1) (Additional file 1: Table S1).
Table 1
Prevalence of onchocerciasis in the Ndikinimeki Health District according to Health Areas, genders and age groups
| Variables | No. individuals examined | No. individuals infected | % prevalence (95% CI) |
| Health Area | | | |
| Boutourou | 116 | 25 | 21.6 (14.5–30.1) |
| Makénéné | 160 | 8 | 5.0 (2.1–9.6) |
| Ndikinimeki | 198 | 7 | 3.5 (1.4–7.1) |
| Ndokowonen | 37 | 1 | 2.7 (0.0–14.2) |
| Nitoukou | 40 | 0 | 0.0 (0.0–8.8) |
| Nyokon | 52 | 1 | 1.9 (0.0–10.3) |
| Gender | | | |
| Males | 307 | 34 | 11.1 (7.7–15.1) |
| Females | 296 | 8 | 2.7 (1.2–5.3) |
| Age group | | | |
| 5–19 | 217 | 5 | 2.3 (0.7–5.3) |
| 20–34 | 93 | 17 | 18.3 (11.0–27.6) |
| 35–49 | 109 | 8 | 7.3 (3.2–14.0) |
| 50-over | 184 | 12 | 6.5 (3.4–11.1) |
| Overall | 603 | 42 | 7.0 (5.2–9.3) |
| No.: number of; CI: confidence interval |
Likewise onchocerciasis prevalence, the overall microfilarial density was 0.557 mf/ss (SD: 3.7843 mf/ss), significantly higher in the Boutourou Health Area compared to the other Health Areas (Chi-square = 47.576; df = 5; p = 0.0001), among males compared to females (Mann Whitney test: U = 41645.5; p = 0.0001), among young adults aged 20–34 years old compared to the other age classes (Chi-square = 25.703; df = 3; p = 0.0001) (Table 2). The intensity of infection was also significantly higher in Kiboum 1 (1.395; SD: 8.4143) and Kiboum 2 (1.814; SD: 5.1986) communities compared to other communities (highest microfilarial density in Makénéné Town Water: 0.979; SD: 4.2643) (Chi-square = 50.490; df = 11; p = 0.0001). The overall CMFL in the study area was 0.168 mf/ss, significantly higher in the Kiboum 1 (0.383 mf/ss) and Kiboum 2 (0.538mf/ss) communities (Additional file 1: Table S1).
Table 2
Intensity of Onchocerca volvulus infection in the Ndikinimeki Health District according to Health Areas, genders and age groups
| Variables | No. individuals examined | Mean microfilarial Density (mf/ss) | Standard Deviation | Min – Max | CMFL (mf/ss) |
| Health Area | | | | | |
| Boutourou | 116 | 1.608 | 6.9391 | 0.0–63.5 | 0.465 |
| Makénéné | 160 | 0.641 | 4.0020 | 0.0–37.5 | 0.165 |
| Ndikinimeki | 198 | 0.189 | 1.1893 | 0.0–12.0 | 0.103 |
| Ndokowonen | 37 | 0.230 | 1.3974 | 0.0–8.5 | 0.084 |
| Nitoukou | 40 | 0.000 | 0.0000 | 0.0–0.0 | 0.000 |
| Nyokon | 52 | 0.019 | 0.1387 | 0.0–1.0 | 0.021 |
| Gender | | | | | |
| Males | 307 | 0.746 | 3.5845 | 0.0–37.5 | 0.266 |
| Females | 296 | 0.361 | 3.9776 | 0.0–63.5 | 0.079 |
| Age group | | | | | |
| 5–19 | 217 | 0.168 | 1.8036 | 0.0–25.5 | - |
| 20–34 | 93 | 1.785 | 7.9075 | 0.0–63.5 | 0.357 |
| 35–49 | 109 | 0.321 | 1.9239 | 0.0–18.0 | 0.096 |
| 50-over | 184 | 0.535 | 2.9449 | 0.0–27.5 | 0.125 |
| Overall | 603 | 0.557 | 3.7843 | 0.0–63.5 | 0.168 |
| No.: number of; mf/ss: microfilariae/skin snip; Min: minimum; Max: maximum; CMFL: community microfilarial load |
Morbidity associated with onchocerciasis
The prevalence of onchocercal clinical signs was in general quite low and variable among Health Areas, communities (clusters), gender and age groups. Indeed, the overall prevalence of palpable nodules was 0.3% (95% CI: 0.1–1.2), ranging between 0.0% and 0.6% and the difference was not significant between Health Areas (Chi-square = 1.416; df = 5, p = 0.923), communities (Chi-square = 8.768; df = 11, p = 0.643), age classes (Chi-square = 2.892; df = 3, p = 0.409) and genders (Chi-square = 0.001; df = 1, p = 1).
The Skin depigmentation and skin rashes overall prevalence were 3.0% and 0.3%, respectively, and no significant difference (p > 0.330) was found across Health Areas (Chi-square = 5.762; df = 5, p = 0.330), genders (Chi-square = 0.154; df = 1, p = 0.694), age classes (Chi-square = 1.037; df = 3, p = 0.792) and clusters (Chi-square = 9.015; df = 11, p = 0.620).
Regarding pruritus, the proportion of individuals affected was significantly higher in the Nyokon Health Area (26.9%; 95% CI: 16.8–40.3) compared to the other health areas (Chi-square = 21.925; df = 5, p = 0.001), the difference was also significant when considering clusters (Chi-square = 92.731; df = 11, p < 0.0001) and age classes (Chi-square = 18.498; df = 3, p < 0.0001), but the difference was not significant when considering genders (Chi-square = 1.436; df = 1, p = 0.231).
History and adherence to ivermectin treatment
Overall, 74.8% (95% CI: 71.2–78.1) of enrolees declared that they have swallowed ivermectin at least once during the past five years. The proportion of individuals who declared that they have ingested ivermectin every year for the past five years was 34.5% (95% CI: 30.8–38.4), similar between males (36.2%; 95% CI: 31.0-41.7) and females (32.8%; 95% CI: 27.7–38.3) (Chi-square = 0.76; df = 1, p = 0.3833). A significant increase in the trend of Ivermectin compliance was observed across the age groups (Chi-square = 64.08; df = 3, p < 0.0001), 22.6% (95% CI: 16.3–30.4) of participants aged 10–19 years old (individuals < 10 excluded), 20.4% (95% CI: 13.5–29.7) of enrolees aged 20–34 years old, 44.0% (95% CI: 35.1–53.4) of interviewees aged 35–49 years old, and 60.3% (95% CI: 53.1–67.1) of participants aged ≥ 50 years old declaring having taken Ivermectin tablets for the past five years. The proportion of systematic non compliers, that is those individuals who never ingested ivermectin tablets during the past five years, was 23.3% (95% CI: 19.9–27.1), similar between males (20.4%; 95% CI: 15.9–25.7) and females (26.3%; 95% CI: 21.3–31.9) (Chi-square = 2.5; df = 1, p = 0.1138). Age classes (Chi-square = 24.59; df = 3, p < 0.0001). Regarding age classes, a significantly higher proportion of systematic non compliers was found among individuals aged < 34 years old compared to their older counterparts (Chi-square = 64.08; df = 3, p < 0.0001). Indeed, 31.6% (95% CI: 24.3–39.9) of participants aged 10–19 years old (individuals < 10 excluded), 36.6% (95% CI: 27.5–46.7) of enrolees aged 20–34 years old, 15.6% (95% CI: 10.0-23.6) of interviewees aged 35–49 years old, and 15.2% (95% CI: 10.7–21.1) of participants aged ≥ 50 years old declaring having never swallowed Ivermectin tablets during the past five years.
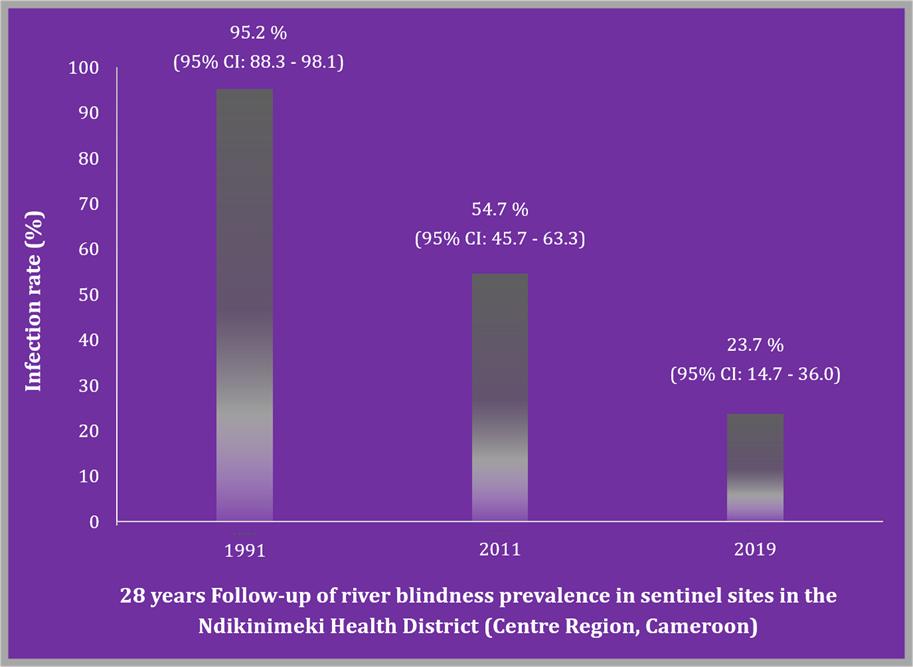
20 years trends of onchocerciasis in the Boutourou health area
The follow up of the trends in river blindness prevalence over three decades was carried out only in the Boutourou Health Area where a sentinel site (Kiboum communities) was identified during mapping exercise and baseline data collected. A significant decrease in the prevalence of onchocerciasis was recorded, either between current findings (2019) and baseline data (1991) (Chi-square = 41.59; df = 1; p < 0.0001), or the first decade trend (2011) (Chi-square = 15.25; df = 1; p < 0.0001) (Fig. 2).