CD79B and PIM1 mutations are independently related to POD12 following first-line immunochemotherapy
Total 32 hotspot driver genes were examined using next-generation sequencing in 145 newly diagnosed patients with DLBCL. All of these genes were mutated in 91.72% patients (133/145) with a median number of 4 (0–24), including single nucleotide variants, frameshift mutations, insertions, and deletions. SNPs were filtered according to the defined criteria. The frequency of CD79B (42.86% vs 9.38%, p = 0.000) and PIM1 mutations (38.78% vs 17.71%, p = 0.005) showed a significant increase in patients with POD12 (n = 49) (Fig. 1), but no difference was found in median number of mutations (5 vs. 4, p = 0.287). When the associations of gender, age, ECOG score, Ann Arbor stage, LDH level, the number of extranodal involvement, IPI score, COO, DE, and positive p53 protein with POD12 were evaluated, univariate analysis displayed an obvious correlation with Ann Arbor stage (p = 0.019), LDH level (p = 0.001), IPI score (p = 0.014), and DE (p = 0.001) (Table 1). Multivariate analysis, including Ann Arbor stage, LDH level, DE, and gene mutations of CD79B and PIM1, revealed that LDH level (OR = 2.990, p = 0.018), CD79B (OR = 5.970, p = 0.001), and PIM1 mutations (OR = 3.021, p = 0.026) were independently correlated with POD12.
CD79B and PIM1 mutations are associated with complex genetic events and unfavorable prognosis
Complex genetic events were seen involving in CD79B and PIM1 mutations (Fig. 2A). There were 36 mutational sites occurring in 30 patients with CD79B mutations, including 8 in the Ig-like V type domain, 5 in the transmembrane domain, and 23 in the immunoreceptor tyrosine-based activation motif (ITAM). A prominent site was identified at the Y196 of ITAM in 63.3% (19/30) of patients. Moreover, 25 gene alterations were observed to accompany with CD79B mutations, only PIM1 (14/36, p = 0.002) and MYD88 L265P (11/16, p = 0.000) mutations having significant correlation. 105 mutational sites of PIM1 were seen in 36 patients, a majority of which occurred in the kinase domain with V177 (4/36, 11.1%), S188 (6/36, 16.7%) and E226 (6/36, 16.7%) having high frequency involvement. There were 30 gene alterations accompanying with PIM1 aberrations, including IRF4 (9/14, p = 0.001) and MYD88L265P (10/16, p = 0.000) alterations having obvious correlation.
By analyzing clinicopathological features, CD79B mutations were significantly associated with DE (p = 0.001) and non-GCB subtype (p = 0.030), and PIM1 mutations were statistically relevant to DE (p = 0.049) and advance stage (p = 0.023) (Supplementary Table 2). Patients with CD79B mutations manifested poorer PFS and OS than wild-type patients, while patients with PIM1 mutations presented poorer PFS, but not OS (Fig. 2B). In a larger cohort [14], both CD79B- and PIM1-mutant patients were found to have worse survival than those with wild-type genes (Fig. 2C). These data indicate that CD79B and PIM1 mutations are associated with complex genetic events and unfavorable prognosis.
A robust predictive model for POD12 is created by incorporating the variables CD79B mutations, PIM1 mutations, and LDH levels
We established a new genetic predictive model for POD12 after integrating LDH levels (OR = 2.990, p = 0.018), CD79B mutations (OR = 5.970, p = 0.001), and PIM1 mutations (OR = 3.021, p = 0.026), which were independently related to POD12. In this genetic predictive model, LDH levels and PIM1 mutations were defined as a score of 1, and CD79B mutations was assigned as a score of 2 based on their OR value. The analysis of AUROC (0.771, 95% CI: 0.689–0.853) demonstrated the model to have a good performance. With the highest Youden's index of 0.4052, scores of 2–4 were recommended to distinguish low- and high-risk patients of POD12 with a sensitivity of 55.10% and a specificity of 85.42%. The incidence of POD12 was significantly increased in patients with scores of 2–4 compared with those with scoring 0–1 (21.15% vs 65.85%, p = 0.000), who also displayed poorer PFS and OS (Fig. 3A and 3B). The genetic predictive model was successfully validated in a cohort of 84 cases and in another larger cohort of 1001 patients [14] (Fig. 3C, and 3D). Our modeling was further compared with traditional IPI score and new molecular subtypes, MCD and Cluster 5, on the power for predicting POD12. The result showed that this model outperformed conventional IPI score and MCD subtype (Fig. 3E). The association between Cluster 5 and POD12 was not found (12/64, p = 0.576) by analyzing reported data [13]. Collectedly, we created a predictive model for POD12 with a powerful performance by incorporating the variables CD79B mutations, PIM1 mutations, and LDH levels.
CD79B and PIM1 mutations indicate better response to BTK and pan-PIM kinase Inhibitors, and BCL2 inhibitor enhances their apoptosis-inducing effects in cells with DE
A novel treatment was evaluated based on our predictive model. By sequencing a panel of 32 hotspot driver genes in 5 DLBCL cell lines, only Val cells had a CD79B mutation in the ITAM domain (T212M), and OCI-Ly8 cells had PIM1 mutations in the kinase domain (S188N and L284F), which were both accompanied by mutations in MYC, BCL2, FOXO1, and CREBBP. Val and OCI-Ly8 cell lines were used to test the effects of CD79B and PIM1 mutations on DLBCL cells sensitivity to BTK inhibitor ibrutinib and pan-PIM kinase inhibitor AZD 1208. Cell proliferation assay was carried out to determine experimental doses of ibrutinib and AZD1208 (Fig. 4A). We found that CD79B-mutant Val cells were more susceptible to 10 µM ibrutinib-induced growth inhibition and apoptosis when compared with CD79B-wildtype OCI-Ly8 cells (p < 0.01); PIM1-mutant OCI-Ly8 cells also presented a better response to 40 µM AZD 1208 than PIM1-wildtype Val cells (p < 0.01) (Fig. 4B, 4C, and 4D). The significance of PIM1 mutations was further confirmed in xenograft mouse models. After AZD 1208 was given daily according to the protocol, tumor growth was significantly suppressed in OCI-Ly8 xenograft mice when compared with Val xenografts (Fig. 5A). These results suggest that CD79B and PIM1 mutations make DLBCL cells sensitive to BTK and pan-PIM kinase inhibitors.
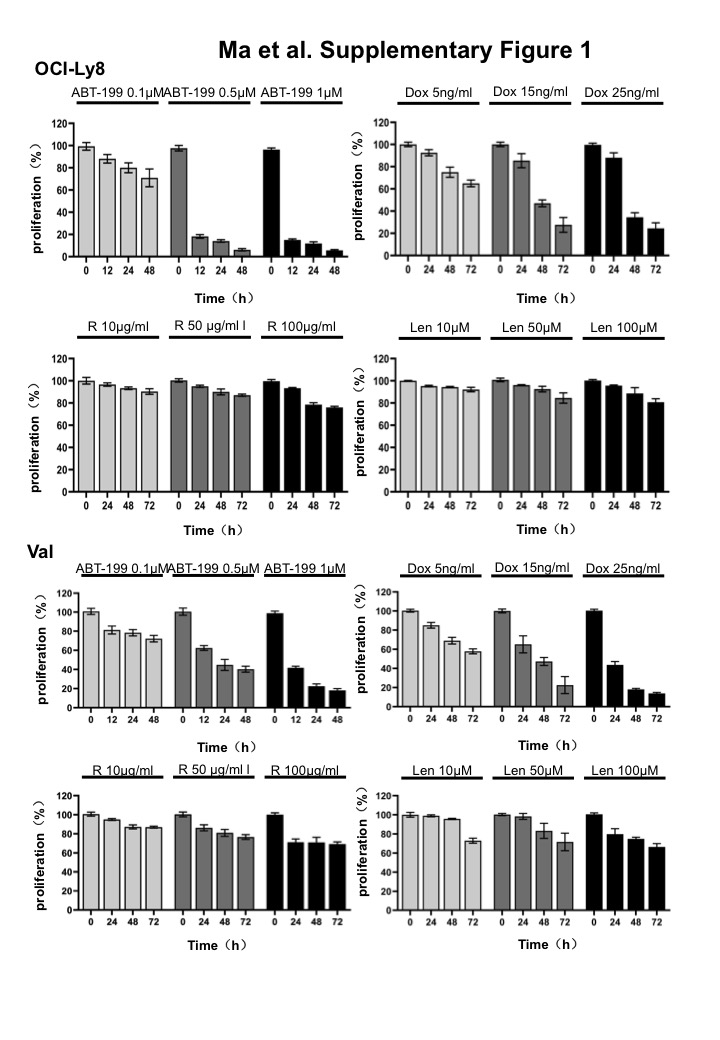
Next, we determined the action mechanisms of the two inhibitors by Western blot. A gradual increase of cytoplasmic IκB and a reduction of nuclear p65 were found after ibrutinib treatment for 24–72 h, while phosphorylated-CDC25A was decreased following AZD 1208 treatment for 24–72 h (Fig. 5B). Both c-MYC and BCL2 proteins were found to present in Val and OCI-Ly8 cells. However, c-MYC expression, but not BCL2 expression, was significantly reduced by ibrutinib and AZD1208 (Fig. 5C). Therefore, BCL2 inhibitor venetoclax was added to enhance the effectiveness of ibrutinib and AZD 1208. We picked 0.1 µM venetoclax for experiment based on the results of cell proliferation assay (Supplementary Fig. 1). Encouragingly, venetoclax did show a prominent synergistic effect when combined with ibrutinib and AZD 1208, even though it alone did not produce obvious apoptosis (Fig. 6A). The observed effect of venetoclax should be attributed to its inhibition of BCL2 function, since BCL2 levels were not affected (Fig. 6B). The combinatorial effect of other key agents for DLBCL therapy, including rituximab, doxorubicin, and lenalidomide, were also examined with ibrutinib and AZD 1208. Their doses in in vitro assay were also chosen based on the results of cell proliferation assay (Supplementary Fig. 1). The results showed that 100 µg/ml rituximab, 15 ng/ml doxorubicin, and 50 µM lenalidomide only produced rather limited synergistic action of apoptosis with ibrutinib and AZD 1208 (Fig. 6A). Although some of them exerted inhibitory effects on BCL-XL and MCL1, they have no effect on BCL2 expression (Fig. 6B), suggesting the importance of blocking BCL2 in promoting apoptosis of mutant cell with DE.