3.1 Effects of early leucine programming on growth and body composition
We analyzed the leucine level in whole-body of zebrafish after early leucine programming at 13 dph. The result revealed that the leucine level in zebrafish of the leucine programming group was higher than that of the control group at 13 dph (P < 0.05) (Fig. 1). The total length of zebrafish in the leucine programming group was higher than that in the control group at 13 dph (P < 0.05). Meanwhile, the total length and body weight of zebrafish in the leucine programming group also increased significantly (P < 0.05) at 83 dph (Table 2). The content of total water, crude protein and crude lipid were detected in zebrafish larvas at 83 dph. The total water content showed no significant difference between the two groups (P > 0.05), and the content of total crude protein in the larvas of leucine programming group was significantly increased (P < 0.05), whereas the total crude fat was significantly decreased (P < 0.05) (Table 3).
Table 2
Growth performance of zebrafish at 13 and 83 dph.
| | 13 dph | 83 dph |
| Control | Leucine | Control | Leucine |
| Body weight (mg) | - | - | 87.61 ± 3.10a | 127.67 ± 2.84b |
| Total length (mm) | 7.36 ± 0.25a | 7.56 ± 0.22b | 18.91 ± 0.35a | 24.11 ± 0.22b |
| Note: Data represent mean ± SEM (n = 6), values that share different letters are significantly different (P < 0.05). |
Table 3
Body composition analysis of zebrafish at 83 dph.
| | Control | Leucine |
| Moisture (%) | 74.14 ± 0.22 | 73.59 ± 0.29 |
| Crude Protein (%) | 16.03 ± 0.17a | 18.27 ± 0.20b |
| Crude Lipid (%) | 7.58 ± 0.09a | 5.12 ± 0.10b |
Note: Data represents mean ± SEM (n = 6), values that share different letters are significantly different (P < 0.05).
3.2 Effect of early leucine programming on mTOR signaling pathway
The phosphorylation status of mTOR downstream factors (S6K1, S6, Grb10) and the mRNA expression of mtor gene were displayed in Fig. 2. At 13 dph, the abundance of phosphorylated S6K1, S6 and Grb10 were increased in the larvas treated with leucine (P < 0.05). Furthermore, at 83 dph, compared with the control group, leucine programming also leaded to the higher abundance of phosphorylated S6K1 and S6 (P < 0.05). The abundance of phosphorylated Grb10 showed no significant difference between the two groups (P > 0.05) (Fig. 2A, B, C). Meanwhile, the mRNA expression of mtor gene was analyzed by real-time qPCR, and the mRNA levels of mtor in the leucine programming group were significantly higher than those in the control group at 13 dph and 83 dph (P < 0.05) (Fig. 2D).
3.3 Expression of genes related to glucose, lipid and protein metabolism
The expression of genes involved in glucose, lipid and protein metabolism, were analyzed by real-time qPCR (Fig. 3). Compared with the control group, the mRNA levels of carnitine palmitoyl transferaseI (cpt1), phosphofructo kinaseI (pfk1), glutamic-pyruvic transaminase (gpt), and leptin A and B of zebrafish larvas in the leucine programming group were significantly higher at 13 dph and 83 dph (P < 0.05). The mRNA levels of citrate synthase (cs), acetyl-CoA carboxylase alpha (accα) and fatty acid synthase (fas) of fish in the leucine programming group were significantly increased at 83 dph (P < 0.01), but no significant difference at 13 dph. The abundance of glutamic-oxaloacetic transaminase (got) of fish in the leucine programming group was significantly decreased at 13 dph (P < 0.01), but no significant difference at 83 dph (P > 0.05).
3.4 Bisulfite sequencing and DNA methylation profiling
To study the genome-wide DNA methylation pattern, we collected the liver tissues from zebrafish in the control group and leucine programming group for constructing genomic DNA libraries. Averagely 30 Gb clean bases after filtering low-quality reads, N reads and adaptor sequences were generated. The sequencing data in this study have been deposited in the Sequence Read Archive (SRA) database (accession number: SUB6149613 and PRJNA559591). The BS conversion rates of genomic DNA ranged from 99.44–99.51%. The high-quality methylation maps of the two groups were obtained, and the unique mapping rates ranged from 56.10–58.48% (Additional file 1). Proportion in total methyl-cytosine of mCG, mCHG and mCHH was summarized for each sample. In the control group, we detected 24,783,377 mC sites, 23,647,352 mCG cites (95.42% of all mC), 265,324 mCHG sites (1.07% of all mC), 870,701 mCHH sites (3.51% of all mC), respectively. Similarly, there were 95.57% mCG, 1.04% mCHG, and 3.39% mCHH in the leucine programming group (Additional file 2).
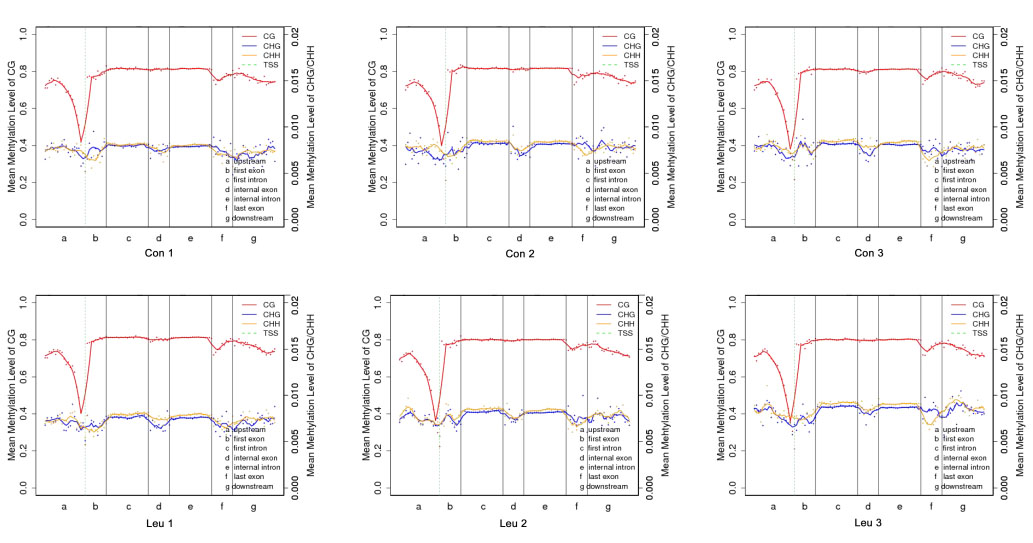
We computed the average level of genome-wide methylation and found that the genome-wide methylation levels of total cytosine and CG methylation types showed no significant difference between the control and leucine programming group, while those of CHG and CHH methylation types in fish of the leucine programming group were significantly increased (Fig. 4A). To further study the global DNA methylation profile, we analyzed the DNA methylation levels of different genomic regions (Fig. 4B, C, D). The average methylation levels of different genomic regions showed no difference between the two groups. A major proportion of methylated sites were present in the regions of introns, and the average methylation level of CDSs was the lowest. In order to reveal the relationship between DNA methylation profiles and genes expression, we analyzed the DNA methylation profiles of transcriptional units which were divided into functional elements as shown in Additional file 3. Similar tendencies of methylation change were observed in different functional elements between the two groups.
DMRs were stretches of DNA in a sample's genome that have different DNA methylation patterns compared with other samples, a sliding-window approach was used to identify DMRs which contained at least five CG (CHH or CHG) sites. We identified a total of 199,750, 671 and 8,314 DMRs in CG, CHG, and CHH contexts (CHH-DMRs, CHG-DMRs, and CG-DMRs) between zebrafish of the control group and leucine programming group at 83 dph, respectively. The CG-DMRs, CHG-DMRs and CHH-DMRs were located in 44,459, 1,128 and 9,572 genes, respectively. The vast majority of DMRs (95.7%) were in the CG context, while only 4.3% DMRs were in CHG and CHH.
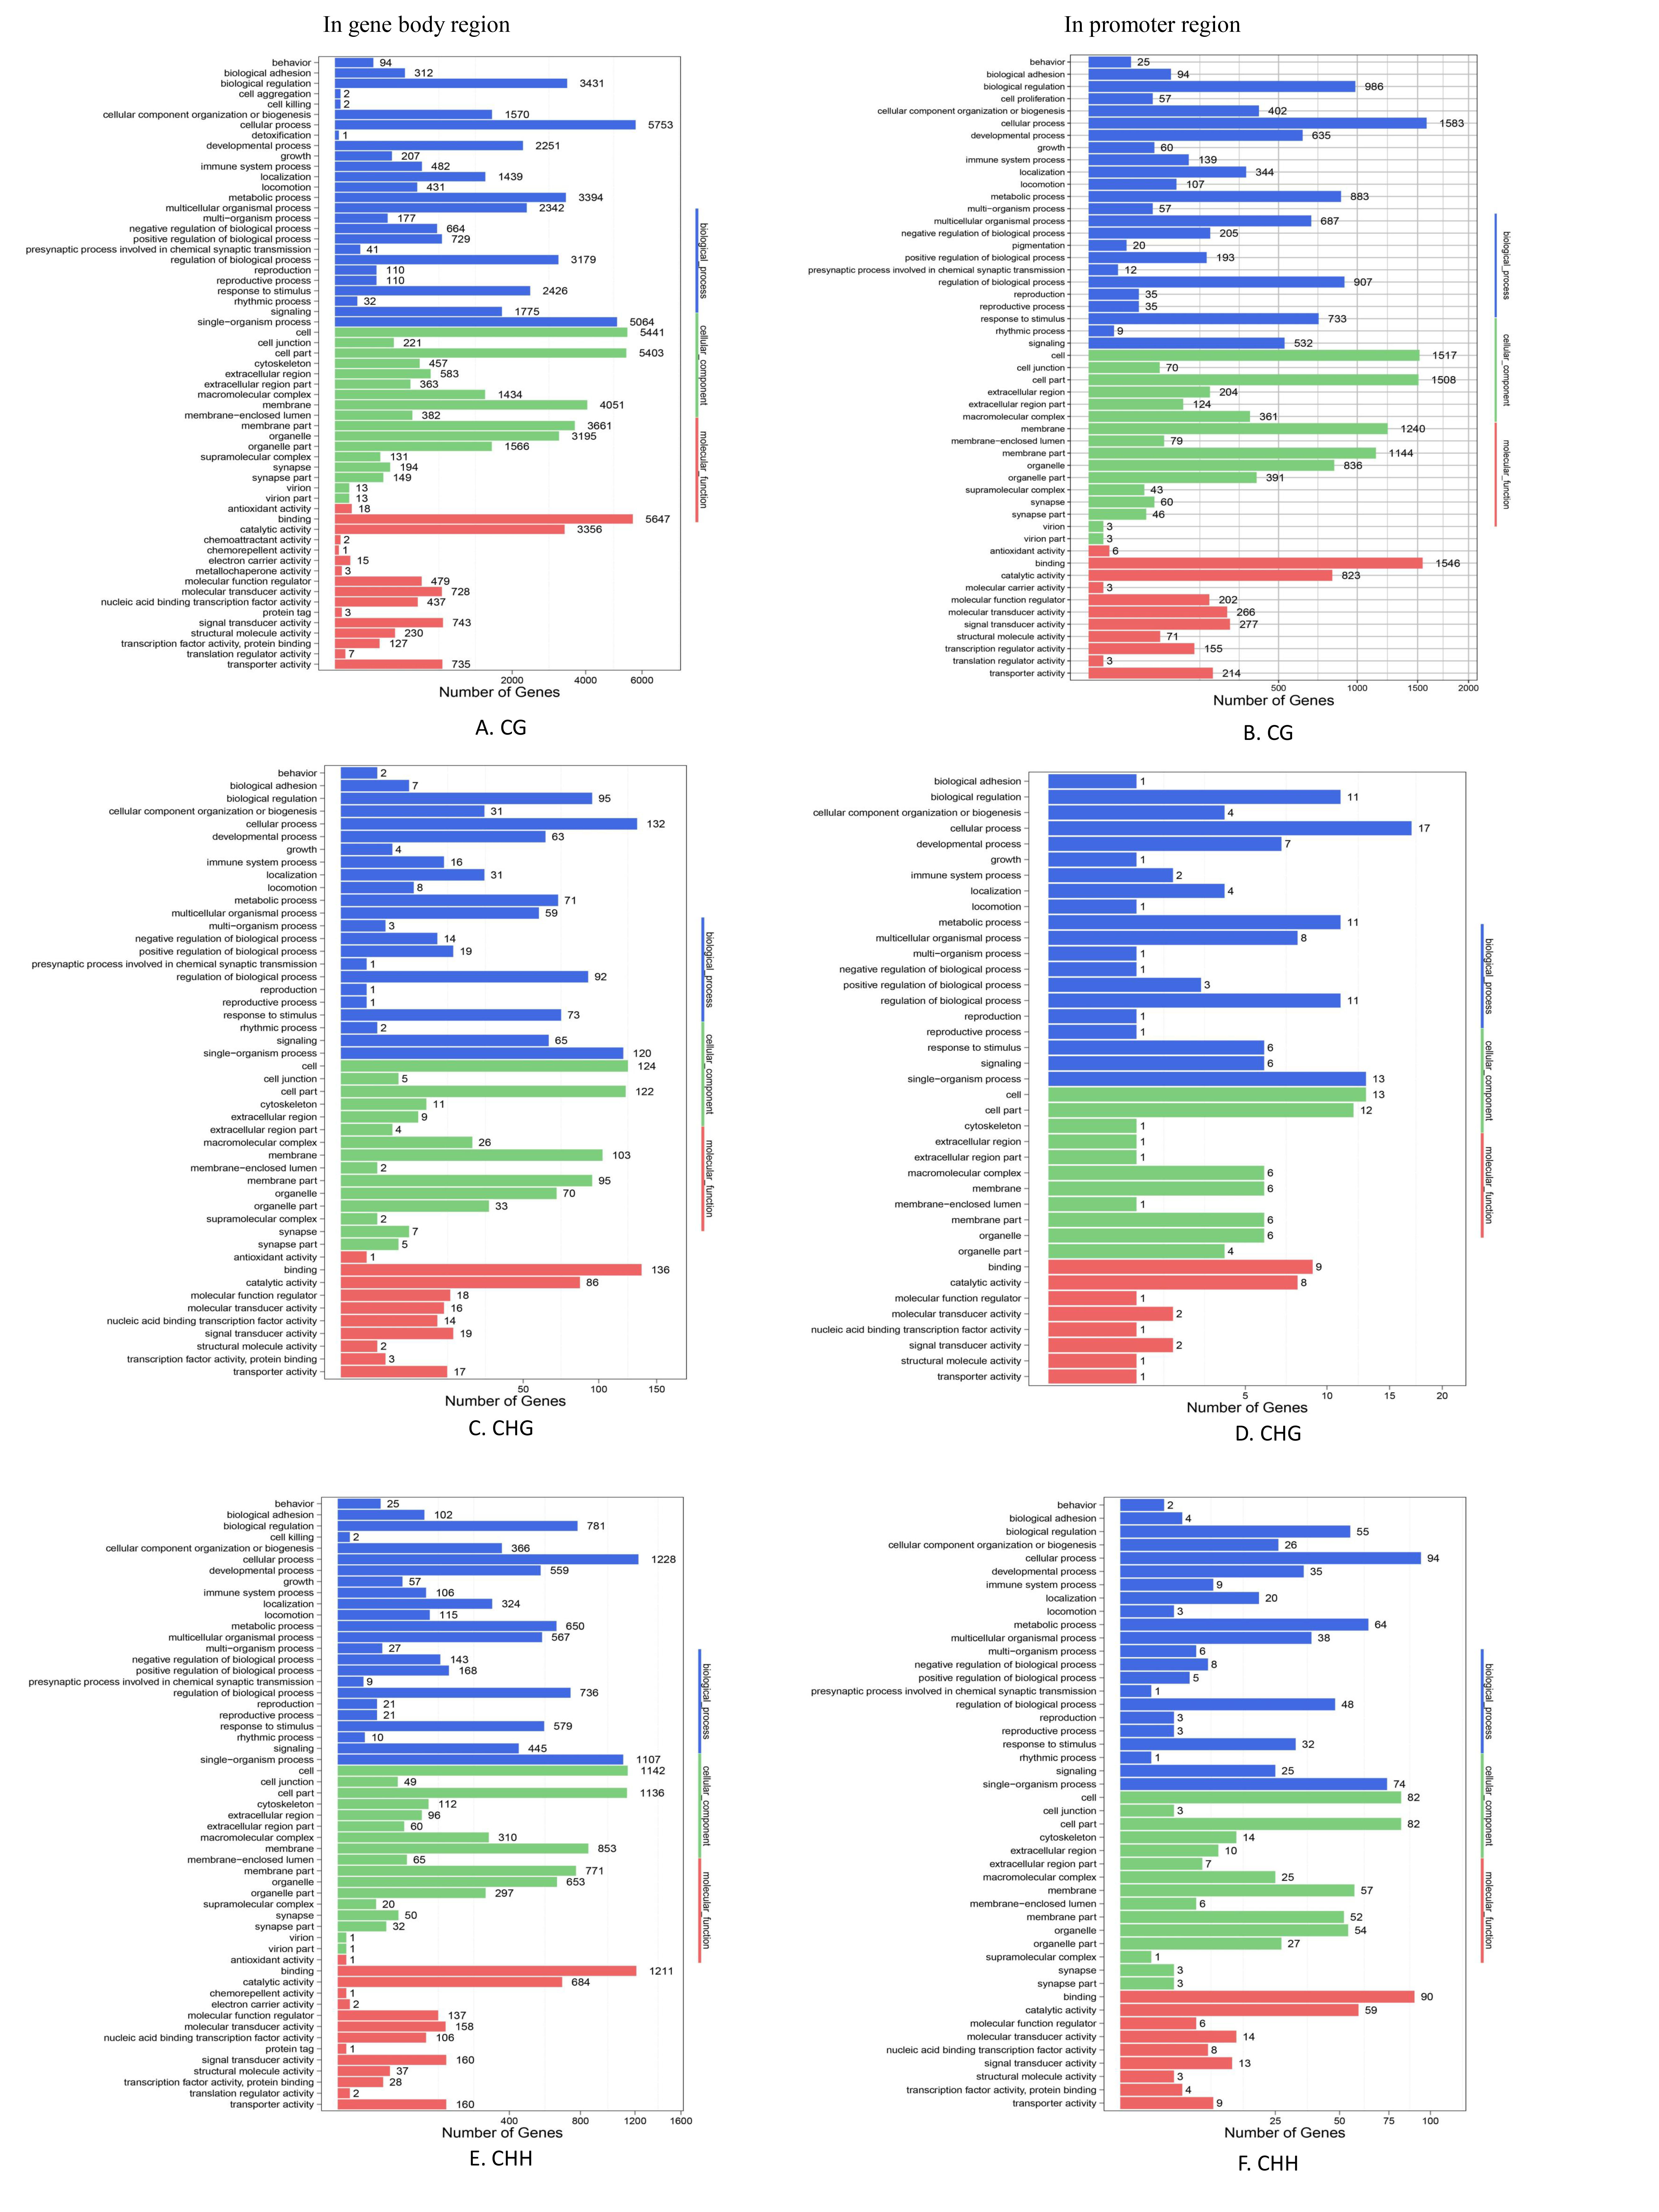
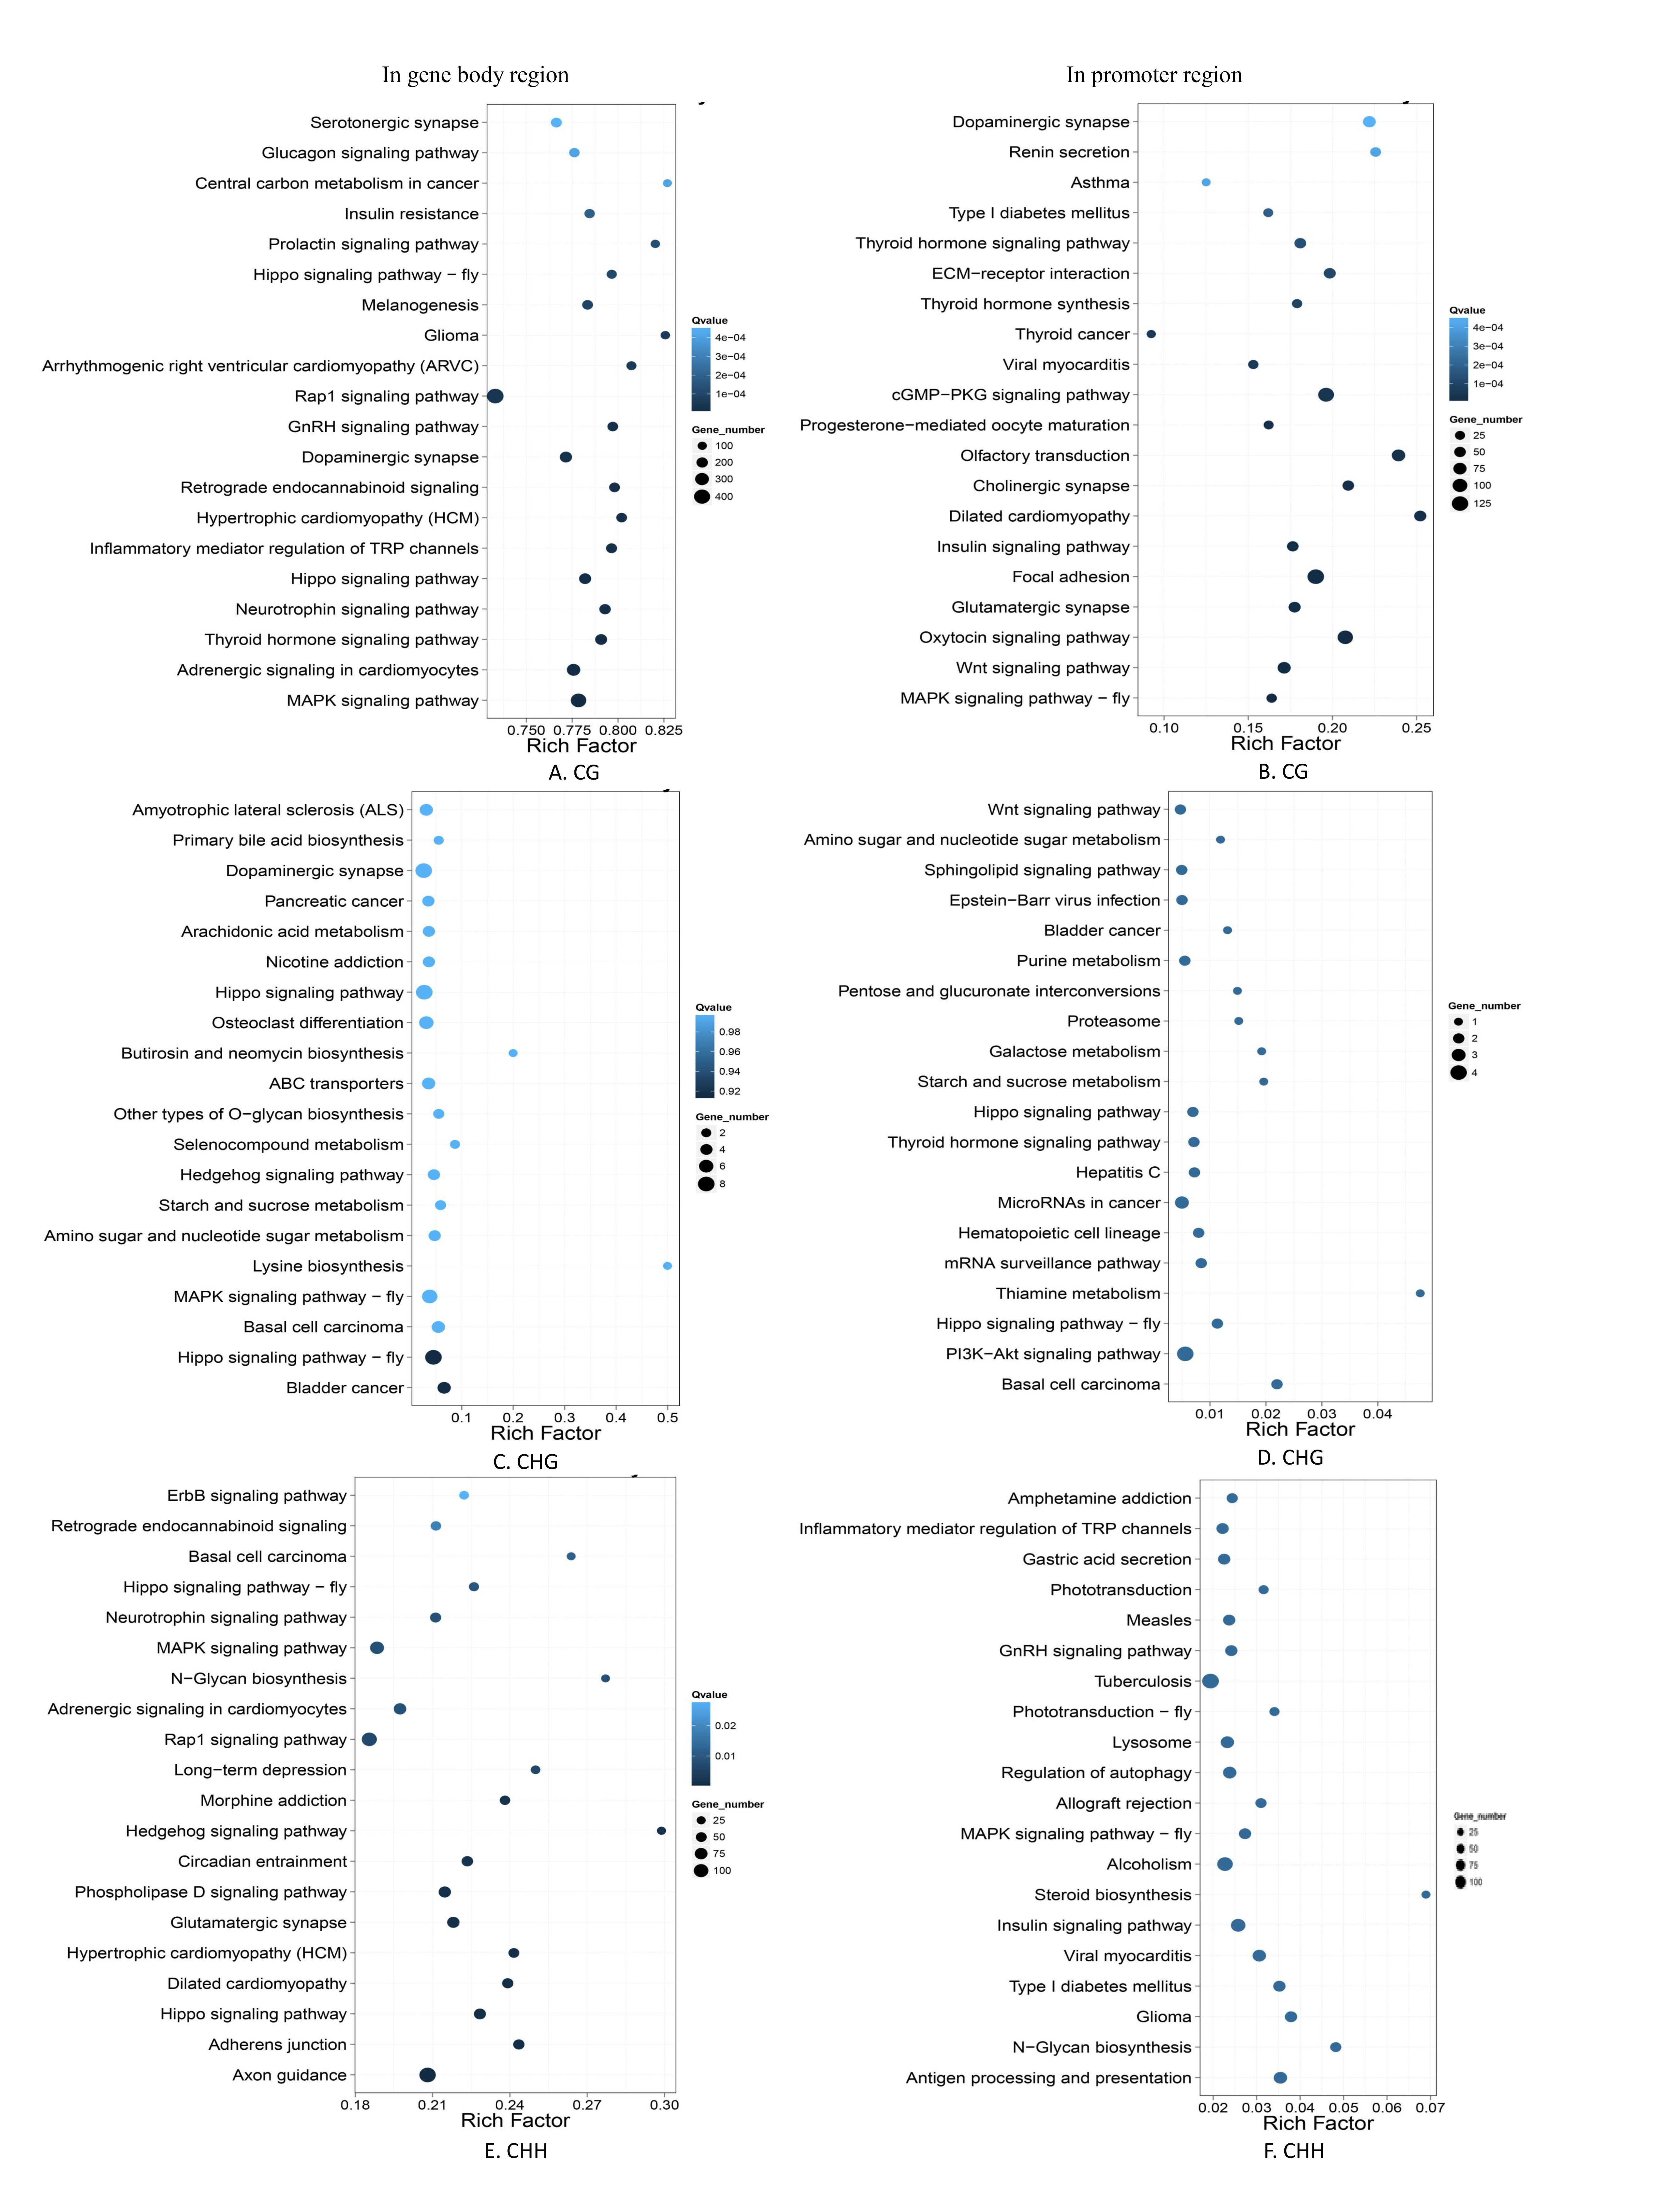
DMRs-related genes were analyzed using KEGG database. In gene body region, 304, 241 and 297 pathways were identified from CG-DMRs, CHG-DMRs and CHH-DMRs, respectively. Furthermore, in promoter region, 302, 75 and 226 pathways were identified from CG-DMRs, CHG-DMRs and CHH-DMRs, respectively. The top 20 pathways in ascending order of corrected p value were listed in Additional file 4. To investigate pathways and processes that may be subject to epigenetic variation in association with DMRs, we conducted a GO enrichment analysis. It is revealed that genes involved in GO terms such as cellular process, biological regulation, metabolic process, binding, catalytic activity, and response to stimulus were significantly over-represented. The top 60 GO terms were listed in Additional file 5 by ascending order of corrected p value.
3.5 Validation of target DMGs by real-time qPCR
The present study focused on the mTOR signaling pathway. According to the bisulfite sequencing, we found that 28 CG-DMGs (such as mTOR, Deptor, eIF4E, 4E-BP, Grb10, mLST8 and SGK1) involved in mTOR signaling pathway, exhibited the lower levels of DNA methylation in fish of the leucine programming group than those of the control group (Fig. 5A). Meanwhile, we also found that 21 CHH-DMGs (such as mTOR, Grb10, GATOR1, GATOR2 and eIF4E) involved in mTOR signaling pathway, exhibited the higher levels of DNA methylation in fish of the leucine programming group than those of the control group (Fig. 5B).
The changes of methylation levels in genomic regions could be associated with the differential expression of genes. To analyze the expression of the DMGs in mTOR signaling pathway, the real-time qPCR was carried out for four DMGs in fish from the leucine programming group and control group. As shown in Fig. 6A, the mRNA levels of Grb10, eIF4E and mTOR genes were significantly higher in fish of the leucine programming group than those of the control group (P < 0.05). Meanwhile, the methylation status of Grb10, eIF4E, mTOR and Wdr24 genes in CG and CHH types were shown in Fig. 6B and C.