4.1 Statistical analysis of TEC over 22 years
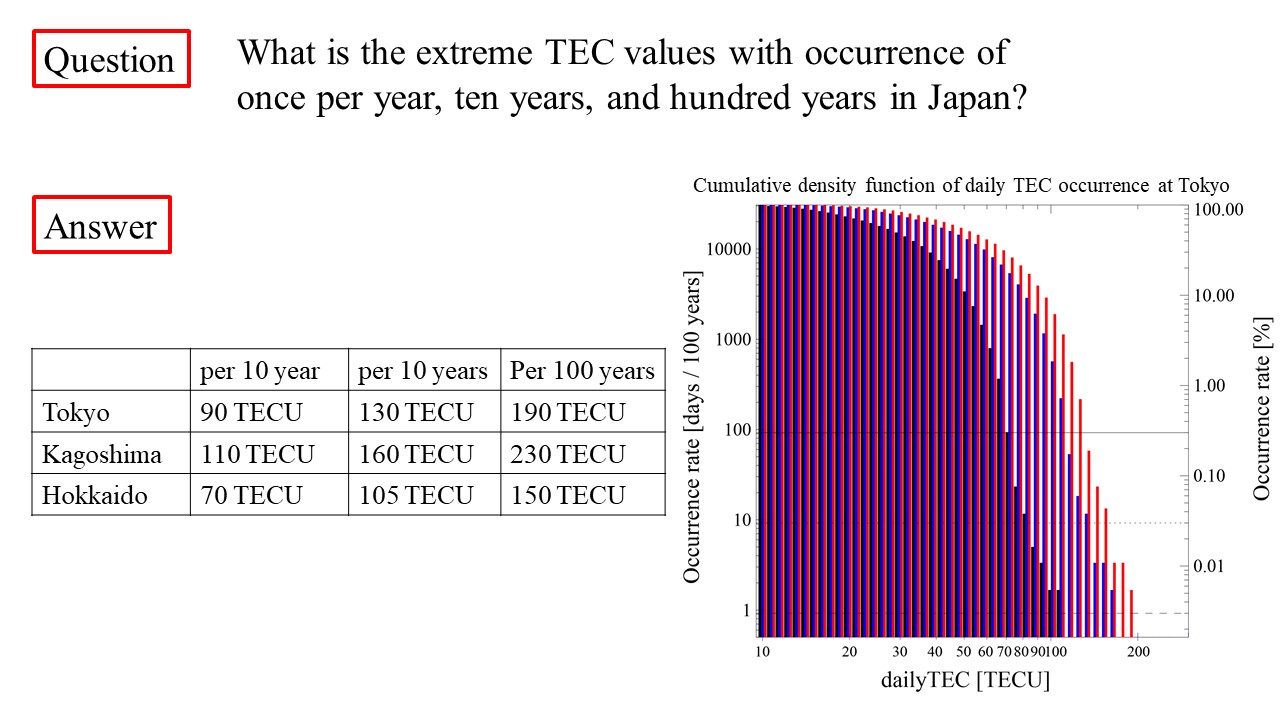
Figure 1 shows the CDF of the daily TEC occurrence at Tokyo. The occurrence rate is shown on the left axis. The occurrence rate on the left-hand axis of the ordinate is days per hundred years, that is, an occurrence rate of one day means an occurrence rate of once per hundred years. The occurrence rate is converted to the occurrence percentage and shown on the right-hand axis of the ordinate. An occurrence probability of 0.3%, which corresponds to a frequency of once per year, is shown as a solid horizontal line. It is found that the daily TEC can reach about 90 TECU with a frequency of once per year. The occurrence probabilities of once per ten years and once per hundred years correspond to 0.03% and 0.003% and are shown with dotted and dashed horizontal lines, respectively. It is found that a daily TEC of more than 100 TECU occurs with a frequency of once per ten years. The TEC values with frequencies of once per year and once per ten years are summarized in Table 1. On the other hand, the daily once-per-hundred-year TEC value cannot be appropriately estimated from Figure 1 because the distribution is based on only 22 years of data.
The colors in the histograms in Figure 1 represent the classifications based on solar and geomagnetic activity: red, pink, blue, and light blue represent days of high solar activity and high geomagnetic activity (HSHG), high solar activity and low geomagnetic activity (HSLG), low solar activity and high geomagnetic activity (LSHG), and low solar activity and low geomagnetic activity (LSLG), respectively. Solar and geomagnetic activities are respectively defined on the basis of the solar sunspot number (SSN) and disturbance storm-time (DST) index, which are provided as sunspot data from the World Data Center SILSO, Royal Observatory of Belgium, Brussels (http://sidc.be/silso/datafiles) and WDC for Geomagnetism, Kyoto (http://wdc.kugi.kyoto-u.ac.jp/dstdir/index.html), respectively. HS (LS) days are defined as days for which the average daily SSN for the previous 27 days is greater than or equal to (less than) 50. HG (LG) days are defined as days for which the average daily DST of the current day and the previous day is less than or equal to (greater than) -50 nT. It can be seen that a TEC of 60 TECU or larger is most likely to be observed when either the solar activity or the geomagnetic activity is high, while those exceeding 100 TECU are observed when the solar activity is high.
4.2 Statistical analysis of foF2 over 22 and 62 years
Here, CDFs of the daily foF2 occurrence are studied in order to estimate once-per-hundred-year values. First, a CDF of the daily foF2 occurrence over the same period as in Figure 1, from 1997 to 2018, were examined in comparison with that of the 22 years of TEC data in Figure 1. Figure 2 shows a CDF of the daily foF2 occurrence, that is, the distribution of the daily foF2 that is greater than or equal to some critical foF2, foF2critical. As in Figure 1, the occurrence rate per hundred years is shown on the left-hand axis of the ordinate and the occurrence rate in percentage is shown on the right axis. The occurrence frequencies of once per year, ten years, and hundred years of 0.3%, 0.03%, and 0.003% are shown as solid, dotted, and dashed horizontal lines, respectively. The colors in Figure 2 represent solar and geomagnetic activities similarly to in Figure 1; red, pink, blue, and light blue represent days of HSHG, HSLG, LSHG, and LSLG, respectively. The largest foF2 was about 16.7 MHz. It is found that foF2 was higher than 15 MHz for only HSHG and HSLG days, which is similar to the result in Figure 1.
The same analysis is carried out for the 62-year foF2 data set from 1957 to 2018. The result is shown in Figure 3 in the same format as Figure 2. The maximum observed foF2 is about 18.7 MHz, which is slightly larger than that obtained from the 22-year data set in Figure 2. Moreover, the occurrence rate of daily foF2 values larger than 16.8 MHz in Figure 3, which corresponds to the rightmost bar in the histogram, is about twice of that in Figure 2.
4.3 Estimation of extreme TEC from slab thickness
As the characteristics of the CDFs of the daily foF2 occurrence are different for the 22- and 62-year data sets, the once-per-hundred-year TEC value cannot be estimated by extrapolating the CDF of the daily TEC occurrence obtained from the 22-year data set. In this section, we estimate the once-per-hundred-year TEC value by using the 62-year foF2 data set.
The value of foF2 is proportional to the square root of the maximum ionospheric density, NmF2. NmF2 is given by the following equation.
NmF2[m-3]=1.24*1010*foF22[MHz]
Figure 4 shows the correlation between daily TEC and NmF2 derived from the daily foF2. All data collected over 22 years are shown in this scatter plot. It can be seen that TEC and NmF2 have a strong correlation. The red line is the least-squares linear approximation of all data. The slope, which is about 250 km, is equivalent to the thickness of the ionosphere that gives a TEC value with a density of NmF2. This parameter, which is called the ionospheric slab thickness, is used to deduce TEC from NmF2 because of the strong correlation between daily TEC and daily foF2.
Since the slab thickness is known to have seasonal dependence, a single value of the slab thickness is not appropriate for estimating TEC from foF2 or equivalently NmF2. Figure 5 shows the slab thickness against the day of the year for 22 years from 1997 to 2018. Data are sparser from June to August compared with other months, because foF2 values often cannot be obtained owing to masking by the sporadic E-layer, which often appears in these months. The red polyline is the monthly mean of the slab thickness. The monthly mean slab thickness is about 180 km in winter and 250 km in summer. Blue and red vertical lines indicate the ranges of ±3σ and ±4.2σ, which are equivalent to a probabilities of once per ten and hundred years, respectively, when the estimated slab thickness is assumed to have a normal distribution.
Here we estimate the daily TEC from the daily NmF2 data, assuming the slab thickness has only seasonal dependence. Figure 6 shows the CDFs of the estimated daily TEC occurrence obtained using the monthly mean slab thickness and observed NmF2 from 1957 to 2018. The black histograms are distributions of the daily TEC estimated with the monthly mean slab thickness, which is shown with a red polyline in Figure 5. The number of days per 100 years and the occurrence rate are shown on the left- and right-hand axes of the ordinate, respectively. The black solid, dotted, and dashed horizontal lines correspond to 0.3% (once a year), 0.03% (once every ten years), and 0.003% (once every hundred years), respectively. The blue histograms in Figure 6 are the distribution of TEC estimated with the average + 3σ slab thickness (upper value of the blue vertical line in Figure 5), which corresponds to a slab thickness with a frequency of once per ten years. According to this histogram, the TEC with a frequency of once per ten years is 130 TECU or more. Furthermore, the red histograms in Figure 6 are derived from the average + 4.2σslab thickness (upper limit of the red vertical line in Figure 3). This result indicates that TEC values of more than 190 TECU can be observed with a frequency of once per hundred years. These TEC values are summarized in Table 1.
4.4 Latitudinal dependence of extreme TEC
Figures 1–6 are results based on data obtained in Tokyo. Here we estimate extreme TEC values for southern and northern Japan because TEC behavior is expected to be different at different magnetic latitudes. Figure 7 shows the correlations of daily TEC between Tokyo and Kagoshima (31.2ºN, 130.6oE, 21.7°N in Mag. Lat) and between Tokyo and Hokkaido (45.2ºN, 141.8oE 36.4°N in Mag. Lat) for 22 years from 1997 to 2018. Basically, the TEC in Tokyo is smaller than that in Kagoshima and larger than that in Hokkaido. The red line represents the linear approximation of these data and reveals that the TECs in Kagoshima and Hokkaido are, on average, 1.2 and 0.8 times that in Tokyo, respectively. From these results, the TEC values with probabilities of once per year, ten years, and hundred years are estimated as 110, 160, and 230 TECU (70, 105, and 150 TECU), respectively, in Kagoshima (Hokkaido) as summarized in the second and third rows in Table 1.