Study data
The demographic characteristics of our 26 kidney transplant recipients are summarized in Table 1. The clinical characteristics for these same receipients are shown in Table 2. A total of 26 different clinical variables were measured. The baseline clinical variables included weight (WT_BL), height, amount of fat in the whole body minus the head (SubTot_Fat_BL), percent fat in the whole body minus the head (SubTot_Pfat_BL), total body mass at baseline (BMI_BL), percent fat in the whole body (WB_Tot_Pfat_BL), blood creatinine (CREATININE_BL), and blood glucose level (GLUCOSE_BL). The following variables were also measured at 3, 6, and 12 months after kidney transplantation: blood creatinine (CREATININE_3M, CREATININE_6M, CREATININE_12M) and blood glucose level (GLUCOSE_3M, GLUCOSE_6M, GLUCOSE_12M). Other variables were measured at 12 months, including the total amount of subcutaneous body fat (SubTot_Fat_12M), percent fat in the whole body minus the head (SubTot_Pfat_12M), total mass of the whole body (BMI_BL), and percent fat in the whole body (WB_Tot_Pfat_12M). Additional clinical variables including BMI and weight change percentage (at 3, 6 and 12 months) were then derived from each of these values. These calculations are represented as BMI_3M, BMI_6M, BMI_12M and WT_CHG_3M, WT_CHG_6M, WT_CHG_12M.
The adipose tissue samples were used to generate raw RNA expression data as a part of a previous study (18). These samples were taken at the time of transplantation surgery, and thus expression data were available for each subject at baseline. We further processed the existing RNA expression data to generate expression profiles for a total of 19,192 genes (see Methods).
In the original study of the dataset, associations between gene expression and weight change were controlled for sex and race. Weight/height traits were frequently shown to be related to demographic characteristics (18, 22). To more accurately control for age, sex, and race as correlated to weight and height traits, we computed the association levels between each of the demographic and clinical variables (Table 3). Using this method, a clinical variable should control for a demographic variable when a significant association was found to be present. We found that weight change variables were not associated with any demographic variable, and age was not associated with any weight and height trait in this study. Height, weight, and BMI variables showed significant associations with sex at all time points (baseline, and 3, 6, and 12 months) and with race at baseline. Therefore, when we calculated the association between eigenvectors and clinical variables, we adjusted height/weight traits for sex and race at baseline and for sex at other time points.
Gene Co-expression Networks and their relationship to obesity traits and fat-related traits in kidney transplant patients
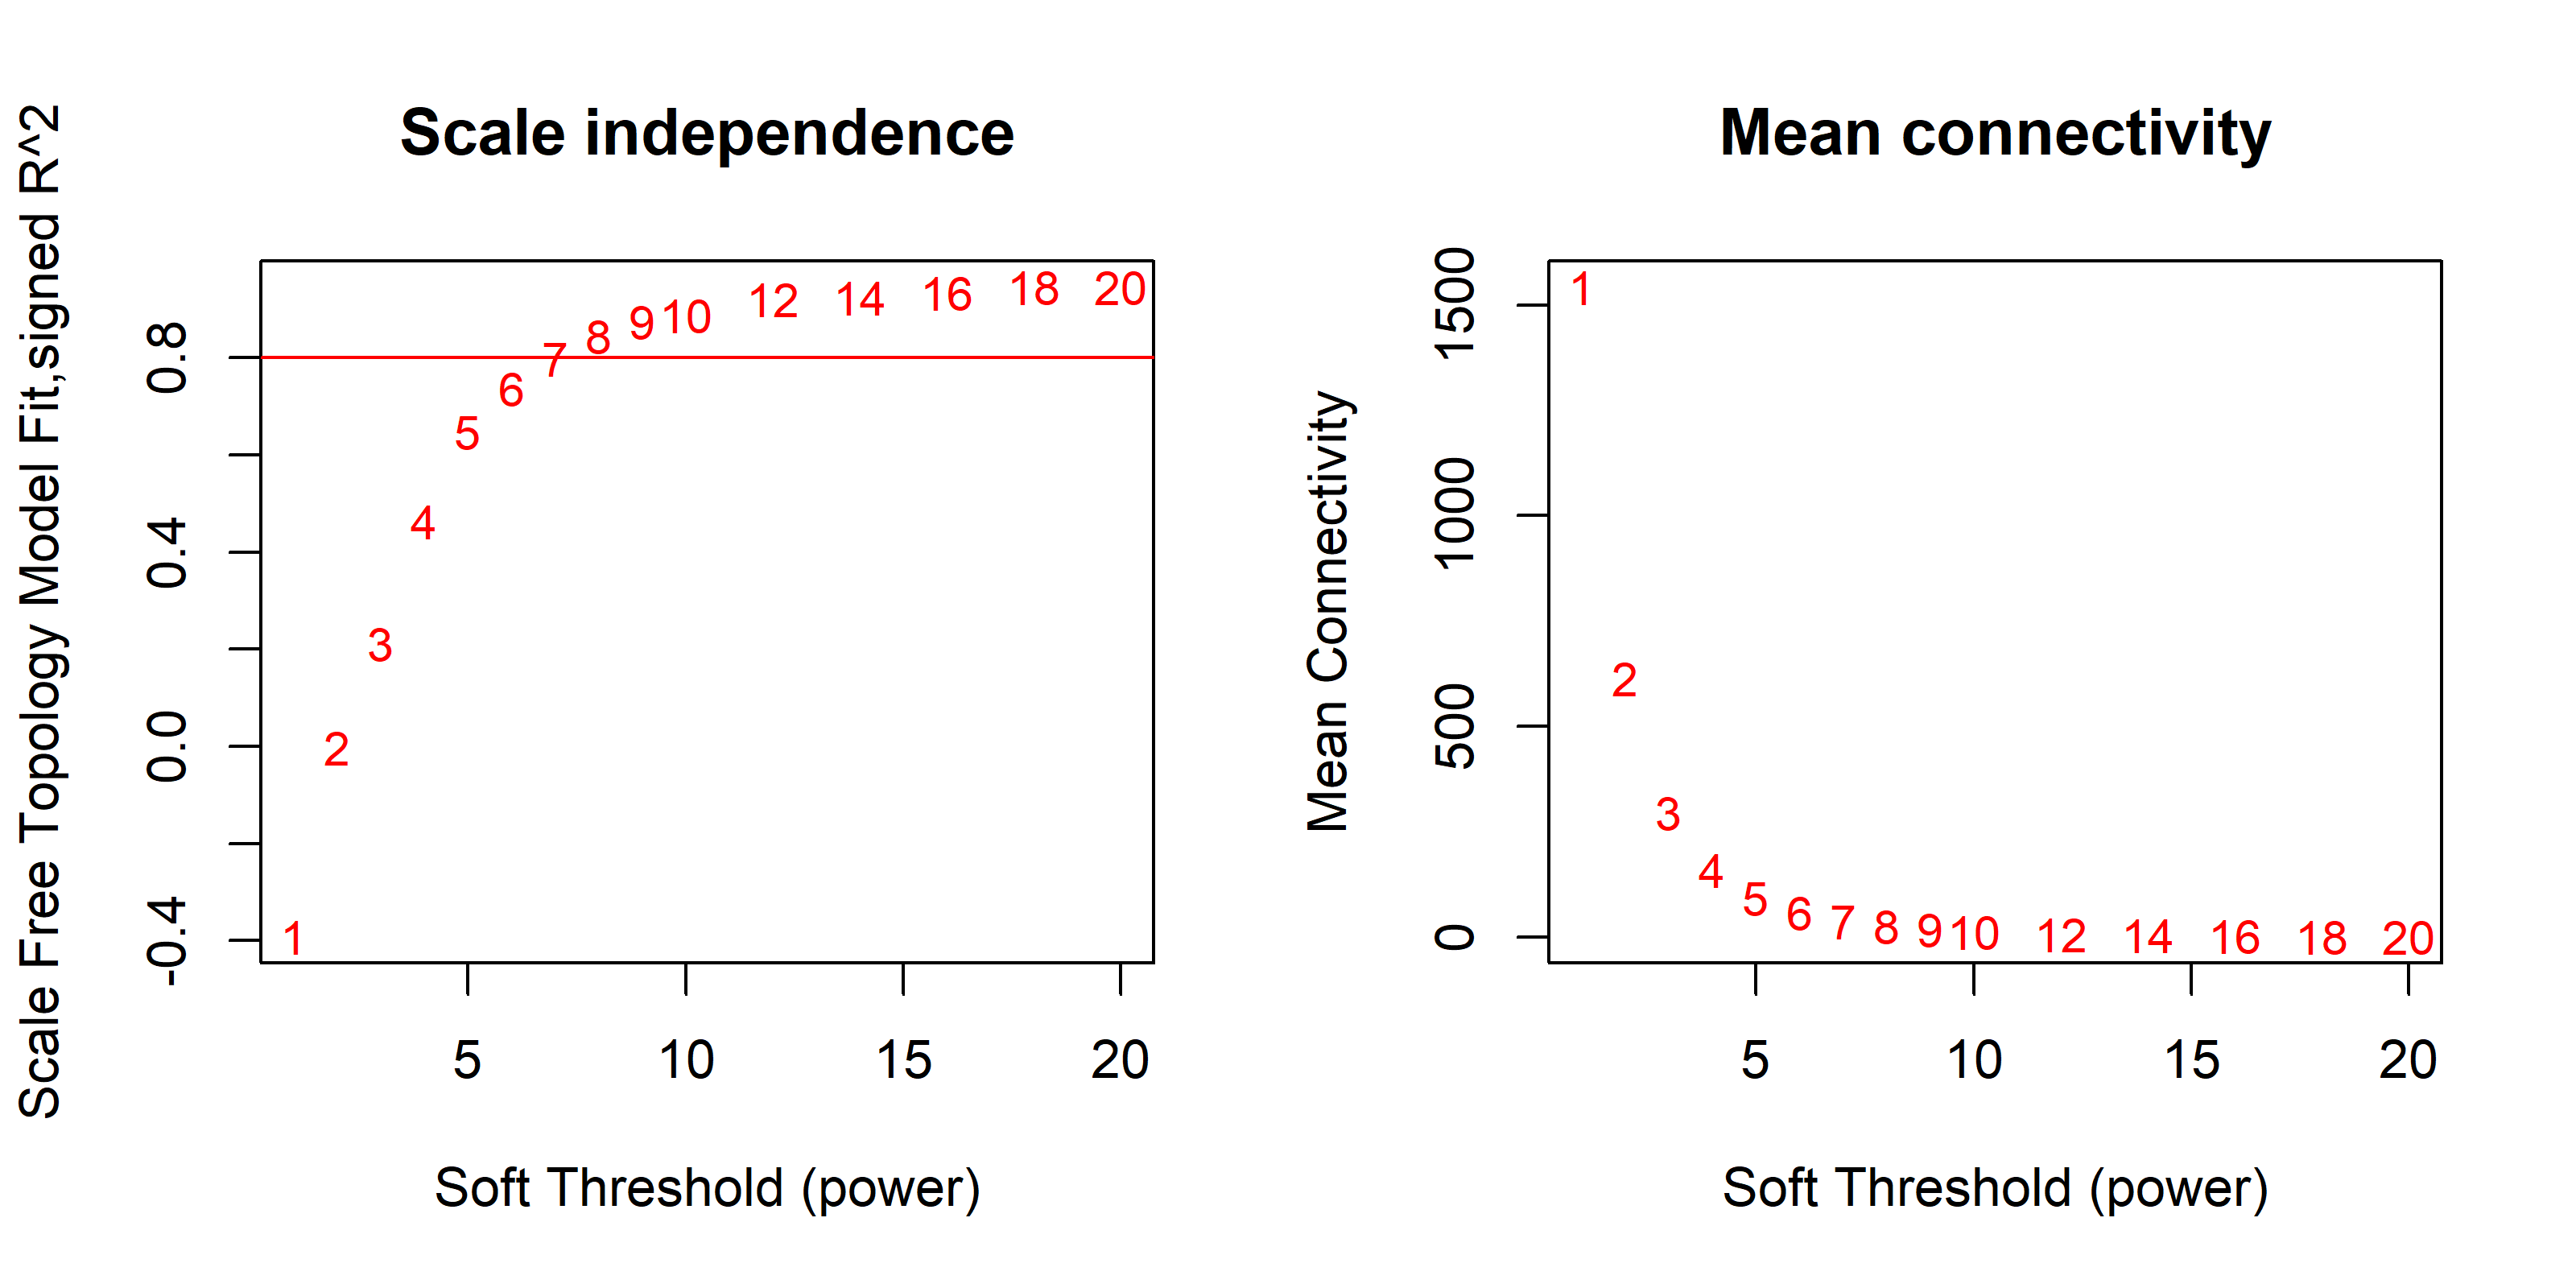
Gene co-expression networks can reveal coordinative behaviors of gene transcription for diseases or medical interventions. We conducted Weighted Gene Co-expression Network Analysis (WGCNA) to obtain a better understanding of gene expression mechanisms underlying obesity-related traits. Only 5,758 (30%) of the most highly expressed genes were examined to reduce the noise (i.e., genes not actually expressed) common to this type of inquiry. Fitting of scale-free topology identified 35 gene modules with sizes ranging from 10 to 1,451 genes and a median size of 49 (Figure 1). We then examined associations between these 35 gene modules and 26 clinical variables (see Methods, Figure 2). For this portion of the study, the p-value was set to a modest 0.01, in order to ensure detection of reliable associations. We found that a total of seven modules showed association with at least one clinical trait: the “magenta” and “darkgreen” modules were frequently correlated with obesity-related traits such as BMI_BL, BMI_3M, BMI_6M, SubTot_Fat_BL, SubTot_Fat_12M, and SubTot_Pfat_12M; “midnightblue” and “skyblue” modules were correlated with fat-related traits (SubTot_Fat_BL, SubTot_Fat_12M, and SubTot_Pfat_12M) but not BMI; the “violet” module was correlated with WT_CHG_6M; the “Lightyellow” module was correlated with CREATINNE_BL; and the “Paleturquoise” module was correlated with CREATINNE_12M.
For each module, its eigenvector represents its major gene expression pattern among its component gene members. The gene module membership measures how close a gene’s expression profile is to its module’s major gene expression pattern, and it is expected that genes with higher module memberships are more functionally important in the module and are more likely to be correlated with clinical traits. In turn, if genes in a module show high correlations between module memberships and gene significance (for association with traits), that suggests that the association between the gene module and the clinical trait is highly reliable. To this end, we made plot gene module memberships and gene significance for the modules associated with clinical traits (Figure 3). We observed that the following module-trait associations are highly reliable: violet and WT_CHG_6M, magenta and BMI_BL, magenta and BMI_3M, magenta and BMI_6M, magenta and SubTot_Fat_BL, midnightblue and SubTot_Fat_BL, lightyellow and CREATINNE_BL, darkgreen and CREATINNE_3M. This analysis confirmed that the magenta module is the most functionally important module for the obesity-related traits.
Functional properties of the magenta model are associated with obesity-related, immune-related, and neurodegenerative traits
We then examined the functional properties of the aforementioned seven modules associated with clinical traits using GO enrichment analysis. Out of the seven modules associated with clinical traits, five (including the magenta module) showed GO enrichment at an FDR-corrected p-value of 0.05. Because the magenta module was identified as the most functionally important module for obesity-related traits, we focused on the functional properties of this module. GO enrichment analysis indentified that the magenta module contained 129 genes, and the module was strongly associated with BMI and fat. The Go term enrichment for the co-expression modules is shown in Table 4. The ToppFun function in ToppGene also revealed that a large proportion of genes were associated with obesity, with 28 of the 123 input genes (6 genes were not found in the ToppGene) having positive results, including lipase (LIPA), phospholipid transfer protein (PLTP), lipin1 (LPIN1), CD36 molecule (CD36), and allograft inflammatory factor (AIF1).
GO enrichment analysis also indicated that other top genes identified within the magenta module included hub genes such as cluster of differentiation 68 (CD68) (38 connections), integrin, Alpha M (ITGAM) (45 connections), and IFI30 Lysosomal Thiol Reductase (IFI30) (30 connections), which play important immune-related functions (Table 4). This is consistent with our functional enrichment analysis of the magenta module using the ToppFun function, which revealed that 15 genes (including CD68 and ITGB2/CD18) within the magenta module have immune-related functions (Table 4).
Other genes within the magenta module were highly associated with neurodegenerative conditions. GO enrichment analysis determined that Phospholipase D Family Member 3 (PLD3) (which had 16 connections in this co-expression network) influenced the processing of amyloid-beta precursor protein. Functional enrichment analysis using the ToppFun function in ToppGene supported these findings. A large proportion of the 123 genes have been associated with neurodegenerative conditions (Table 4). In fact, 37 Alzheimer’s related genes were identified within the magenta module, which is the highest number of genes significantly associated with one disease in the magenta module. Furthermore, 20 genes were associated with amyloidosis, 16 were associated with other neurodegenerative disorders, and 11 with cerebral atrophy. A select number of genes associated with Alzheimer’s Disease are depicted in Table 4, which may be mediated by through alterations in dopamine pathways due to obesity (22).
IPA identified ten significant networks in the magenta module (Figure 4). Nine of the 10 networks had scores ranging from 14-52. The top network (score 52) was associated with lipid metabolism, inflammatory responses, and cell compromise. Other networks included genes involved in cardiovascular disease, immunological disease, and neurological disease. Top canonical pathways included the complement system, phagosome maturation, autophagy, granulocyte adhesion and diapedesis, and lipid antigen presentation by CD1. The role of these systems in immunological disease, obesity, and neurological disease are consistent with the functional properties associated with the magenta module found using GO Enrichment Analysis and ToppFun.