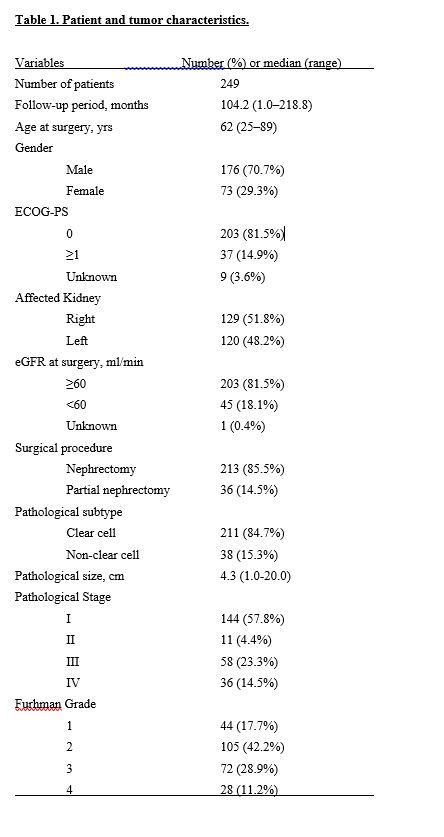
Patient characteristics
A total of 249 patients were enrolled in this study. The median follow-up period was 104 months. Table 1 shows the clinicopathologic features of the enrolled patients. A total of 68 patients (27.3%) died during follow-up periods and the 5-year OS rate and the 5-year CSS rate were 82.5% and 86.1%, respectively. Of the 213 patients who underwent curative surgery, 45 patients (21.1%) had recurrent disease and the 5-year RFS rate was 84.5%.
Evaluation of HE4 protein ICH with HE4 ISH
We assessed HE4 expression by IHC and RNA ISH in tissue specimens. HE4 expression by RNA ISH was consistent with the results of IHC staining. Expression was primarily observed in uriniferous tubular cells. With regards to the IHC images of highly stained substances in the uriniferous tubules, it is possible that the HE4 protein is contained in the reservoir, as the tubular epithelium is positive in ISH (Fig.1).
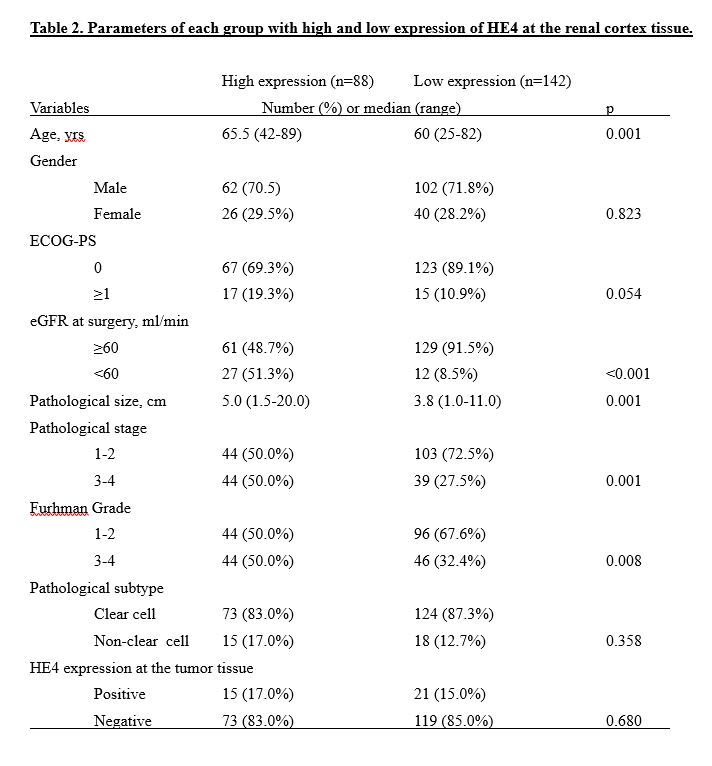
HE4 protein expression at the TMA
We investigated HE4 protein expression in TMAs of 247 tumors and the corresponding 230 cortexes. HE4-positive staining was confirmed in 37 (15.0%) tumors and in 88 (38.3%) cortexes. In the tumors, HE4-positive staining was confirmed in 12.9% of all clear cell RCCs and in 27.0% of all non-clear cell RCCs (p=0.026). In cortexes, HE4-positive staining was confirmed in 37.1% of all clear cell RCCs and in 45.5% of all non-clear cell RCCs (p=0.358). HE4-positive staining was mainly located in the cytoplasm of tumor cells and uriniferous tubular cells at the cortex tissues (Fig. 2). The association between HE4 expression levels and clinicopathologic features were not detected in tumor TMAs. However, several correlations were presented at HE4 expression in the cortex TMA and clinicopathologic features (Table 2). Patients with a high expression of HE4 in the cortex were more likely to be older in age, have a lower eGFR, larger tumor size, higher pathological stage, and higher Furhman grade than the patients with low expression. No association was detected between HE4 expression in tumor TMAs and in cortex TMAs.
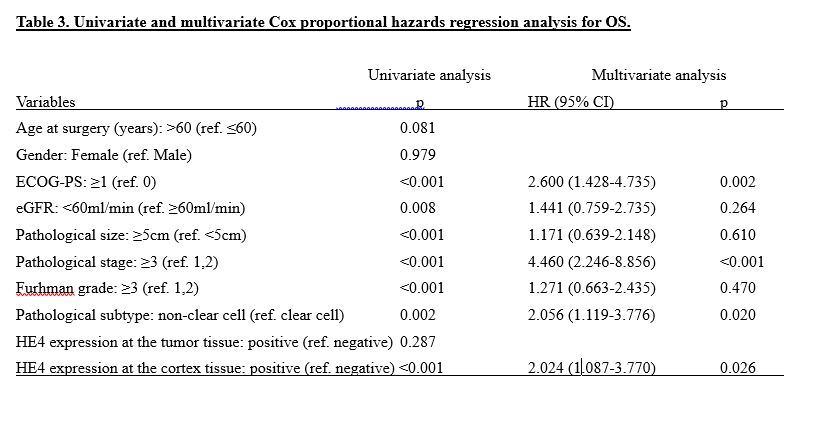
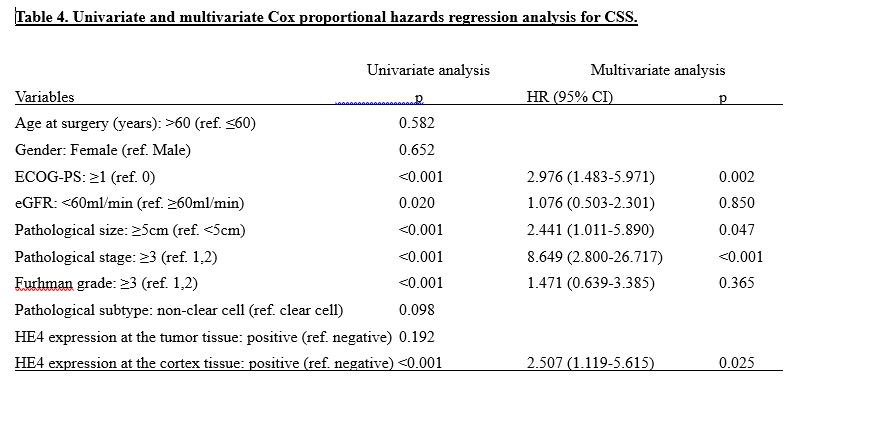
High expression of HE4 is associated with cancer prognosis
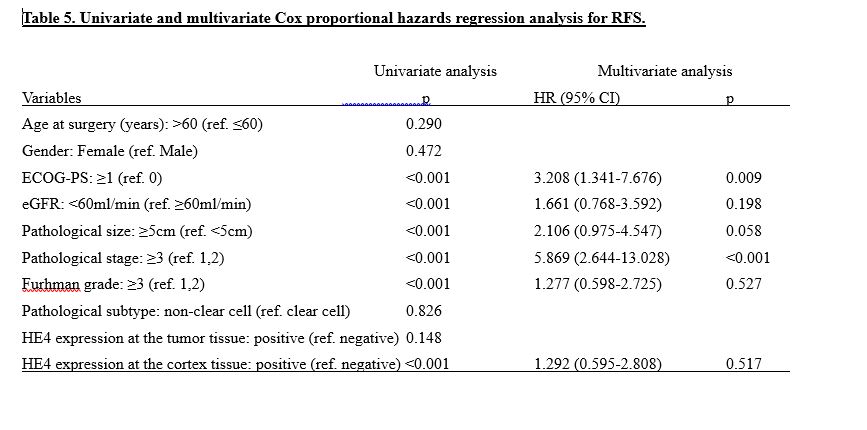
The high expression of HE4 in tumors was not associated with OS, CSS, or RFS (HR 1.379 (95% CI 0.763-2.492); p=0.287, HR 0.505 (95% CI 0.181-1.410); p=0.192 and HR 0.468 (95% CI 0.167-1.310); p=0.148, respectively). However, Kaplan-Meier analyses indicated the high expression of HE4 at the cortex was associated with an increased risk of OS, CSS, and RFS (HR 3.608 (95% CI 2.127-6.118); p<0.001, HR 5.759 (95% CI 2.801-11.841); p<0.001 and HR 3.309 (95% CI 1.751-6.252); p<0.001, respectively) (Fig. 3 A-C). The 5-year OS rate, CSS rate, and RFS rate were 69.4%, 76.8%, and 72.9% in the high HE4 group and 93.5%, 94.9%, and 91.8% in the low HE4 group. Multivariate analysis revealed that the ECOG-PS, stage, pathological subtype, and high expression of HE4 were independent risk factors for poor OS (Table 3) and that ECOG-PS, tumor size, stage, and high expression of HE4 were independent risk factors for poor CSS (Table 4). For the RFS, ECOG-PS and pathological stage were independent risk factors; however, high expression of HE4 was not found to be an independent risk factor (Table 5.). However, patients who had recurrence of RCC with high HE4 expression (n=24) had significantly worse OS and CSS after recurrence than patients with low HE4 expression (n=16) (HR 2.777 (95% CI 1.027-7.508); p=0.044 and HR 3.072 (95% CI 1.022-9.228); p=0.046, respectively).
We also performed a subgroup analysis for the expression of HE4 in OS by age, gender, ECOG-PS, eGFR, pathological size, pathological stage, Furhman grade, and pathological subtype (Fig. 4). The high expression of HE4 was a poor risk factor for OS, regardless of age, gender, tumor size, localized or metastatic, or Furhman grade. However, it was not significant risk factor for patients with a poor ECOG-PS, low eGFR, or non-clear cell subtype.