Transcriptional Levels of IGF2BPs in Patients with Pancreatic Cancer
Three IGF2BPs factors were identified in mammalian cells, and the expression levels of IGF2BPs were compared in various cancers via the GEPIA database. IGF2BP1 mRNA expression level was not up-regulated in pancreatic cancer, but IGF2BP2 and IGF2BP3 were up-regulated in pancreatic cancer to varying degrees (Figure. 1).
GEPIA database was utilized to further analyze whether there was a difference in the expression of IGF2BPs factor between pancreatic cancer and normal pancreatic tissue. In studies of ONCOMINE, the expression of IGF2BP1 in pancreatic cancer tissue was not significantly different from that of normal pancreatic tissue. However, in Segara and Pei Pancreas’ dataset,IGF2BP2 is over-expressed compared with that in the normal sample in pancreatic carcinoma with a fold change of 3.446 and 2.657, respectively (Table 1) [12-16].Regard to IGF2BP3, four pancreas’ dataset all indicated an overexpression in both pancreatic carcinoma and pancreatic ductal adenocarcinoma (Table 1).
Relationship between the mRNA Levels of IGF2BPs and the Clinicopathological Parameters of Patients with Pancreatic Cancer.
We utilized the TCGA database to compare the expression levels of the IGF2BP family in normal pancreatic tissues and pancreatic cancer. Among them, the expression levels of IGF2BP2 and IGF2BP3 were significantly increased in pancreatic cancer (Figure. 2A). With the GEPIA (Gene Expression Profiling Interactive Analysis) dataset (http://gepia.cancer-pku.cn/), we compared the mRNA expression level of IGF2BP protein family between pancreatic cancer and normal tissue. The results showed that the expression of IGF2BP1 genes in pancreatic cancer was not different from that in normal pancreatic tissue samples. However, a higher expression levels of IGF2BP2 and IGF2BP3 were observed (Figure. 2B).
Clinical correlation analysis in Pancreatic Cancer Patients
Further, we performed a prognostic analysis of IGF2BP1, IGF2BP2, and IGF2BP3 in pancreatic cancer with the LinkedOmics and GEPIA dataset. In the LinkedOmics dataset, the high expression of IGF2BP1, IGF2BP2, and IGF2BP3 was associated with substantially poor overall survival (OS) of pancreatic cancer (Figure. 3A). Interestingly, for IGF2BP1 and IGF2BP2, consistent results were observed in the prognostic analysis of the GEPIA dataset (Figure. 3B).
The association between IGF2BP1-3 and each subset of grade&stage was analyzed by R software via the Wilcox test. P-value<0.05 was considered to be statistically significant. We found that the expression level of IGF2BP2 and IGF2BP3 continuously increased in each subgroup of grade, except for the grade 4 (Figure. 4A). In the clinical stage, IGF2BP1-3 gradually increased in the subgroup but there was no statistical difference (Figure. 4B).
Univariate and multivariate COX regression analysis
Cox's proportional hazards model was applied to analyze related factors that may affect the overall survival of pancreatic cancer patients, in which IGF2BP2 and IGF2BP3 were identified as independent prognostic factors (Figure. 5A, B). In both univariate and multivariate analysis, low expression of IGF2BP2 and 3 suggested better OS. In multivariate analysis, the HR of IGF2BP2 was 1.415 with 95% CI was 1.133–1.768, and the HR of IGF2BP3 was 1.052 with a 95% CI was 1.017–1.019. Further, based on the results of multivariate cox regression analysis, we established a nomogram model that may predict patient’s survival (Figure. 5C).
Gene mutation information
Cbioportol was utilized to calculate the gene mutation information in pancreatic cancer samples from TCGA database. In general, missense mutation was detected to be the most frequent mutation classification in pancreatic cancer. Collectively, SNP and C>T were confirmed to be the most fundamental Variant Type and SNV class, respectively. The median variation for each sample is approximately 26. Finally, we detected the top 10 mutations in pancreatic cancer, including TP53, KRAS, TTN, MUC16, SMAD4, CDKN2A, RYR1, RNF43, PCDH15 and ARID1A (Figure. 6A). Then, compared with the top 10 mutation types, we detected the mutation types of IGF2BP1-3 including missense mutation and silent (Figure. 6B).
Gene set enrichment analysis of IGF2BP2-3
In order to fully understand the biological attributes of IGF2BP2 and IGF2BP3, we conducted gene set enrichment analysis. Based on the results of GSEA, the top three up-regulated enriched pathway terms of IGF2BP2 were: adherens junction, pentose phosphate pathway and pentose and glucuronate interconversions; the principal down-regulated biological pathway enriched of IGF2BP2 were: primary bile acid biosynthesis, neuroactive ligand receptor interaction and glycosphingolipid biosynthesis ganglio series (Figure. 7A). The top three up-regulated enriched pathway terms of IGF2BP3 were: pathogenic Escherichia coli infection, thyroid cancerand adherens junction; the principal down-regulated biological pathway enriched of IGF2BP3 were: glycine serine and threonine metabolism and nenroactive ligand receptor interaction (Figure. 7B).
Gene functional enrichment analysis
In order to fully understand the biological attributes of IGF2BP2 and IGF2BP3, we utilized the Kyoto Encyclopedia of Genes and Genomes (KEGG) and gene ontology (GO) analysis. We biologically enriched genes, based on the results of DAVID, positively related to the expression levels of IGF2BP2 and IGF2BP3. In GO analysis, the three biological processes in which genes positively related to IGF2BP2 expression level are involved: regulation of cytoskeleton organization, neutrophil activation and neutrophil degranulation. The three cell components involved in these co-expressed genes include: adherens junction, cell-subsrate junction and focal adhesion. In addition, the three main molecular functions of these co-expressed genes include: cell adhesion molecule binding, cadherin binding and actin binding (Figure. 8A). In pathway analysis of genes that positively related to IGF2BP2 expression level, the top three enriched terms were: salminella infection, shigellosis and pathogenic escherichia coli infection (Figure. 8A). In GO analysis, the three biological processes in which genes positively related to IGF2BP3 expression level are involved include: viral life cycle, regulation of chromosome organization and regulation of mRNA metabolic process. The three cell components involved in these co-expressed genes include: adherens junction, cell-substrate junction and focal adhesion. In addition, the three main molecular functions of these co-expressed genes include: cell adhesion molecule binding, cadherin binding and transcription coregulator activity (Figure. 8B). In KEGG pathway analysis of genes that positively related to IGF2BP2 expression level, the top three enriched terms were: human papillomavirus infection,endocytosis and salmonella infection (Figure. 8B). Finally, the result of GO and KEGG analysis to biologically enrich genes that were positively correlated with IGF2BP2 and IGF2BP3 expression levels, the top 10 relevant biological processes including: cell junction organization, salmonella infection, mitotic nuclear division, cell cycle, et al. (Supplementment Figure 1).
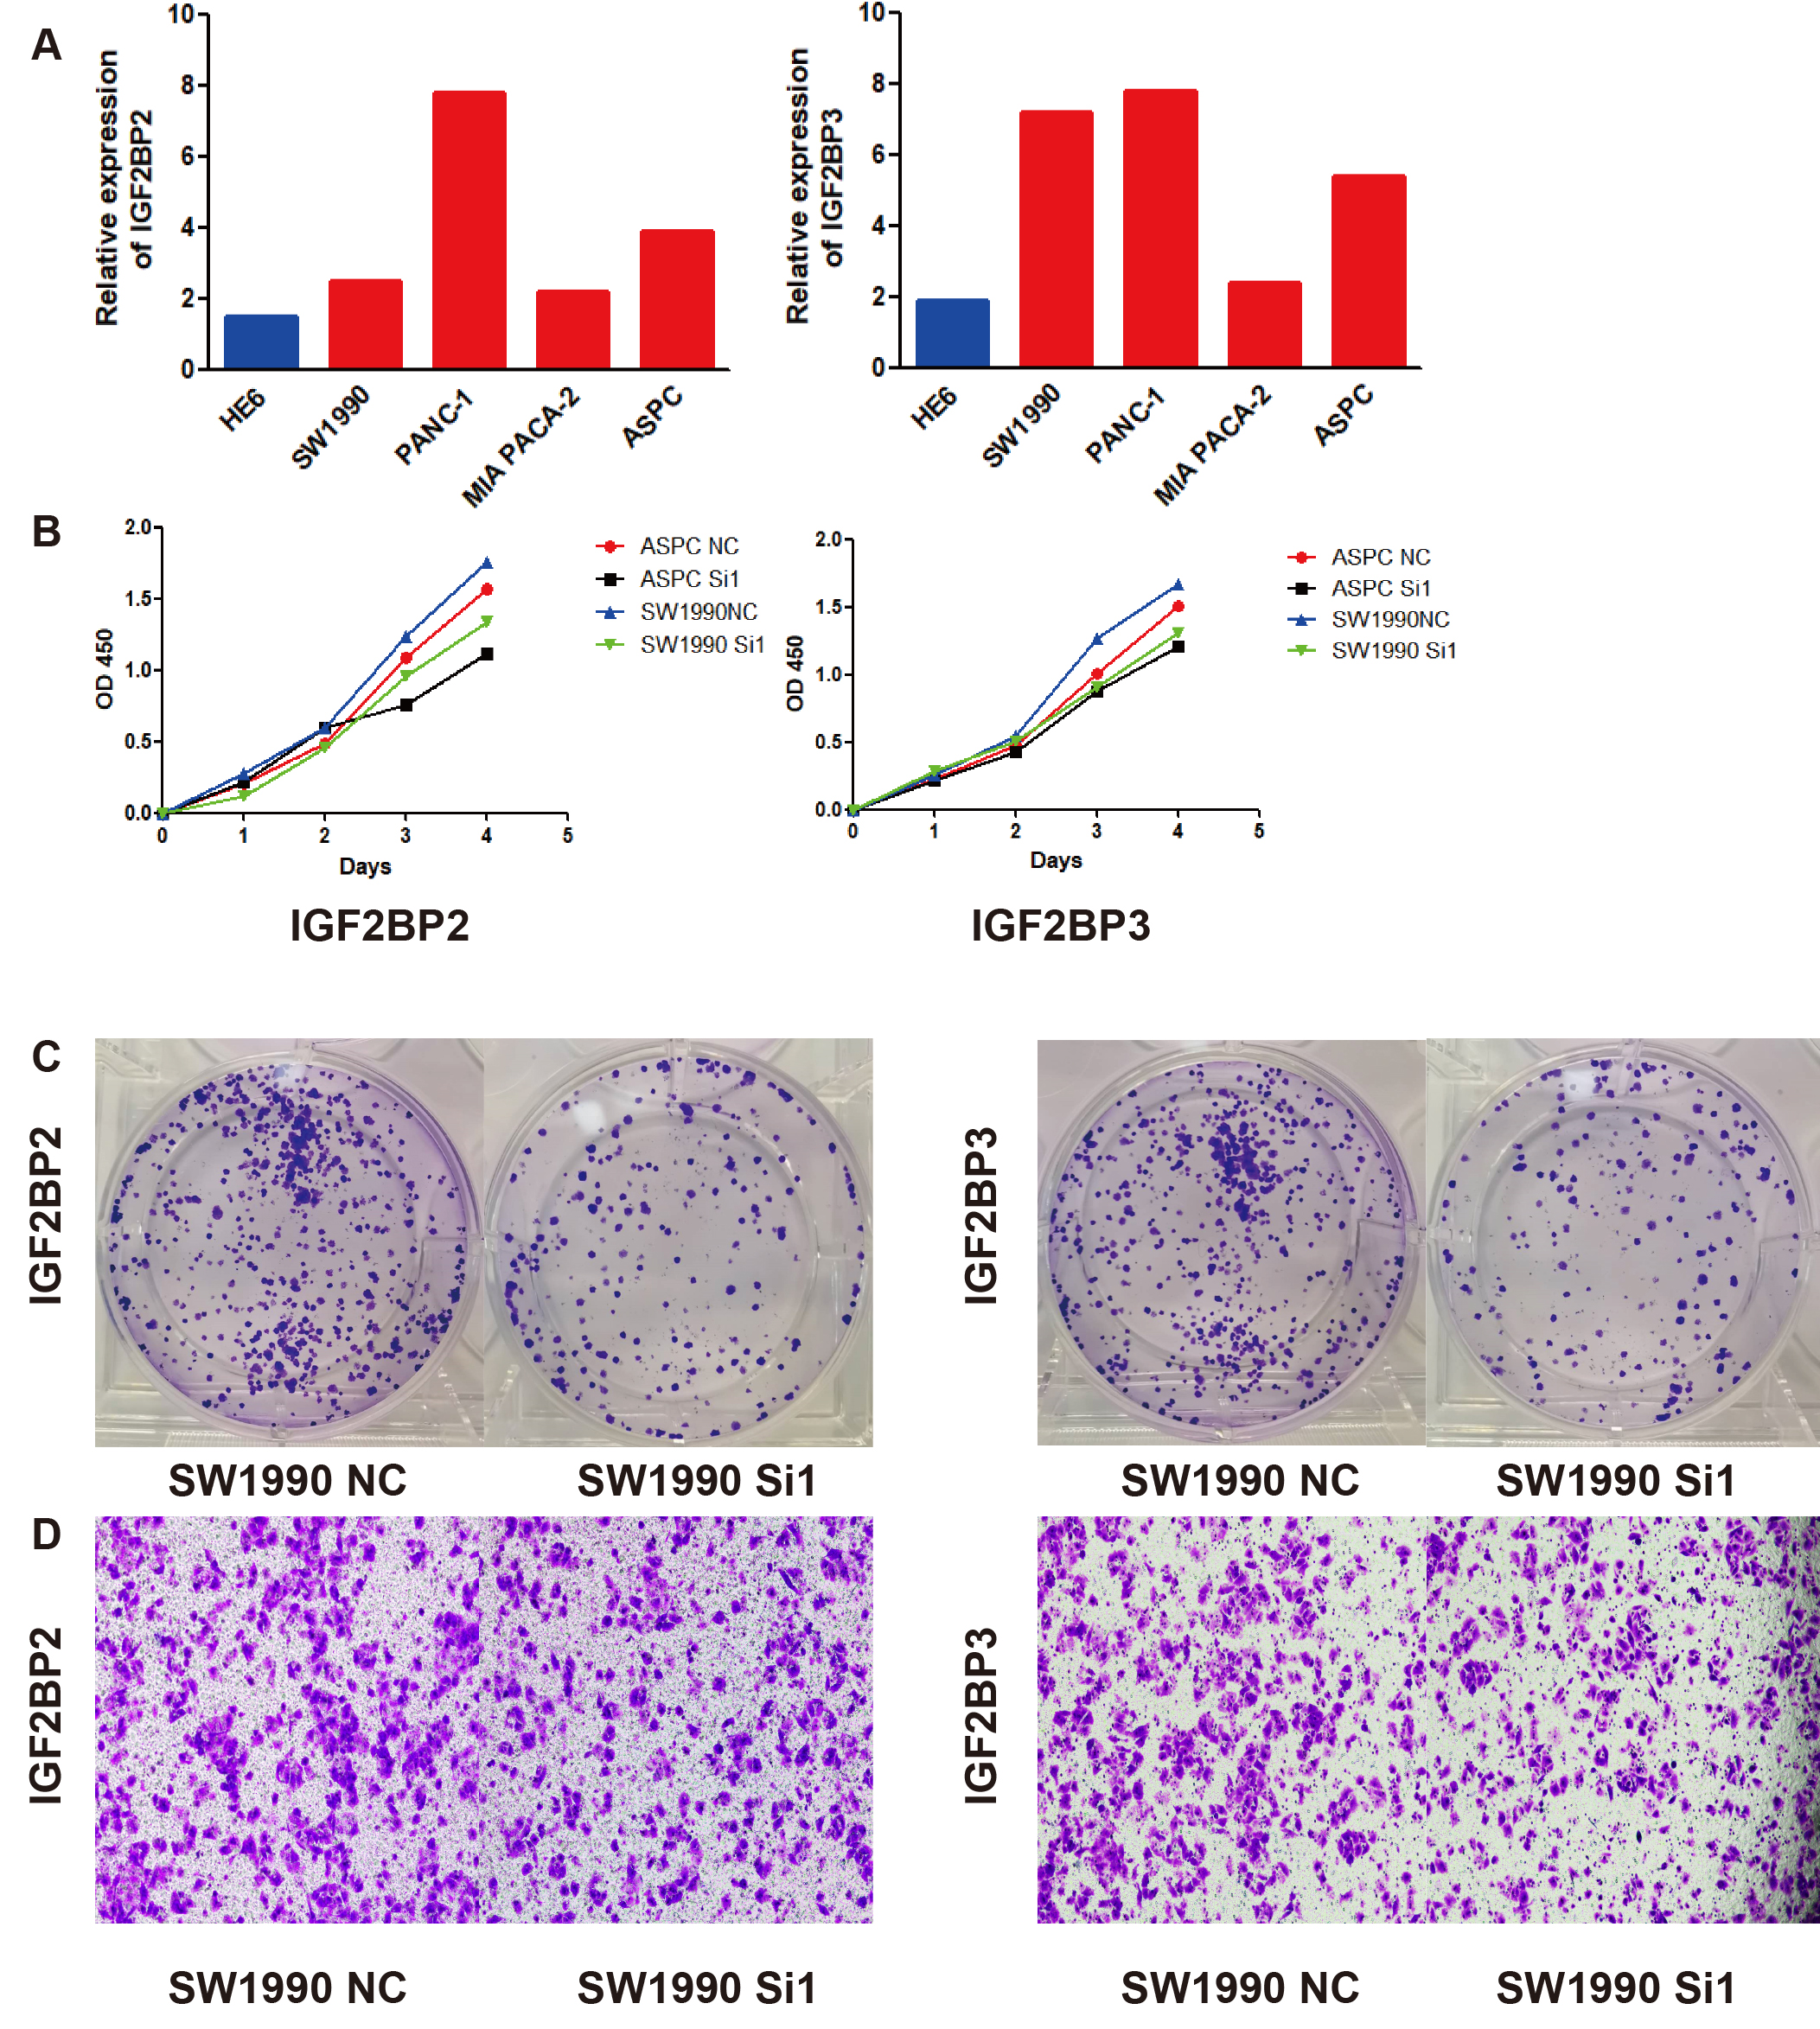
IGF2BP2 and IGF2BP3expression and function in cell lines
For further exploration of IGF2BP2 and IGF2BP3 expression in cell clines, qPCR was performed. As expected, IGF2BP2 and IGF2BP3 protein was significantly increased in pancreatic cancer cell lines compared with HPDE6-C7, meanwhile the expression of IGF2BP2 and IGF2BP3 in pancreatic cancer cell lines showed further increased (Figure 9A). As predicted in GSEA analysis above, we inferred IGF2BP2 and IGF2BP3 promotes proliferation or metastasis of pancreatic cancer to accelerate its progression. The growth rate of pancreatic cancer cell lines transfected with IGF2BP2 siRNA and IGF2BP3 siRNA was significantly slower than that of NC group (Figure 9B, C). In cell invasion analysis, knockdown of IGF2BP2 and IGF2BP3 significantly decreased the invasion rate of SW1990 (Figure 9D).