Cell culture
IPEC-J2 cells (DSMZ, Germany) were cultured with Dulbecco’s modified Eagle’s medium and F12 Ham’s medium (DMEM-F12; Gibco, USA) containing 5% heat-inactivated fetal bovine serum (FBS; Corning, USA), 1% insulin-transferrin-selenium-X (ITS-X; Gibco), and 1% antibiotics in an incubator at an atmosphere of 5% CO2 and 39°C. For differentiation, IPEC-J2 cells were seeded at 1 × 10⁵ cells/mL in 500 μL DMEM medium, as described above, on 1.12-cm2 polyester membrane inserts (pore size, 0.4 μm); the basolateral side was filled with 1 mL DMEM. After 4 days, the culture medium was replaced with differentiation medium (DMEM-F12 supplemented with 5% heat-inactivated FBS and 1% antibiotics), cultured for 7–10 days, and differentiated within the insert until they attained a transepithelial electrical resistance (TEER) of > 5,000 Ω.
Preparation of ETEC K99 and phage EK99P-1
ETEC K99 and phage EK99P-1 [19] were donated by iNtRON Biotechnology (Korea). ETEC K99 was spread on an agar plate containing 3% tryptic soy broth (TSB), 1.5% Bacto Agar (all from BD Biosciences, USA) and incubated at 37°C overnight. One colony was selected for inoculation in 10 mL 3% TSB media, and incubated for 4–5 h in a shaking incubator at 150 rpm and 37°C until the optical density (OD) reached 1.0. Then, phage EK99P-1 was diluted in elution buffer (10 mM Tris-Cl, pH 8.5) at a density of 7.3 × 10⁸ plaque-forming units (pfu)/mL.
Bacterial infection and adhesion assay
Differentiated IPEC-J2 cells cultured in a Transwell were washed with pre-warmed phosphate-buffered saline (PBS) and then placed in infection media (DMEM-F12 supplemented with 5% heat-inactivated FBS without antibiotics). The cells were infected with ETEC K99 at a density of 1 × 10⁷ cfu/mL for 24 h at 37°C and 5% CO2. For the adhesion assay, infected IPEC-J2 cells were washed with pre-warmed PBS three times and then lysed in 0.1% Triton X-100 for 5 min. The lysates were serial diluted and each inoculum, plated onto TSB agar and stored overnight. Viable bacterial cells were quantified as colony-forming units (cfu).
TEER measurement
IPEC-J2 cells were grown on a 1.12-cm2 polyethylene terephthalate membrane insert (pore size, 0.4; Corning, USA) and treated with ETEC K99 and/or phage EK99P-1. TEER was measured using an epithelial volt/ohm meter (EVOM2; World Precision Instruments, USA). Briefly, 0.5 and 1.0 mL of pre-equilibrated medium were added to the apical and basal chambers. Measurements were performed after obtaining a steady signal for 5 min in the blank insert, and corrected by subtracting the background of the blank Transwell inserts and medium-only inserts. The final TEER reading was reported in Ω cm2 (TEER measurement × area of membrane).
Dextran permeability measurement
Differentiated IPEC-J2 cells were cultured in a Transwell and treated with ETEC K99 and phage EK99P-1 for 24 h, and then washed with pre-warmed PBS three times. Cell culture medium containing 4 or 40 kDa dextran conjugated with fluorescein isothiocyanate (dextran-FITC) was added to the upper compartment of the Transwell plate at 2.2 mg/mL. After 1 h of incubation, the fluorescence intensity in the lower compartment of the Transwell plate was measured using a fluorescence multiple plate reader (Victor 3; Perkin Elmer, USA). The excitation and emission wavelengths were 490 and 520 nm, respectively.
Porcine peripheral blood mononuclear cell (pPBMC) isolation
Porcine blood samples were obtained from 4- to 6-month-old Landrace–Yorkshire–Duroc pigs (Hyupsin Food Co., Ltd., Korea). The use of porcine blood was approved by the Institutional Animal Care and Use Committee of Seoul National University (IACUC no. SNU-150327-2). Porcine whole blood was diluted with PBS at a ratio of 1:1, and pPBMCs were isolated by density gradient centrifugation (400 × g for 20 min without brake) using Ficoll-Paque Plus (Amersham Bioscience, UK). pPBMCs were suspended in RPMI 1640 medium supplemented with 10% FBS and 1% penicillin/streptomycin.
Co-culture IPEC-J2/PBMCs
IPEC-J2 cells were seeded at a density of 1 × 10⁵ cells/mL in 500 μL DMEM medium as described above on 1.12-cm2 polyester membrane inserts (pore size, 0.4); the basolateral side was filled with 1 mL DMEM. During cell growth and differentiation, the medium in both compartments was replaced three times per week for 7–9 days. Then, pPBMCs (2 × 10⁶ cells/mL) were seeded in the basolateral compartment of the Transwell plate with 1 mL RPMI media, and ETEC K99 and phage EK99P-1 were added to the apical compartment.
Western blot analysis
To examine the effect of phage EK99P-1 on tight junction proteins, 1 × 10⁵ cells were cultured on 12-well plates for 2 days until confluence was reached. Confluent IPEC-J2 cells were treated with ETEC K99 and/or phage EK99P-1, washed with PBS and then lysed in a RIPA lysis buffer (50 mM Tris–HCl, 150 mM NaCl, 1% NP_40, 0.5% sodium deoxycholate, 0.1% sodium dodecyl sulfate containing protease inhibitor), followed by protein quantitation using a Micro BCA kit (Thermo, USA). The same amount of extract was loaded into 12% Tris–glycine polyacrylamide gel and electrophoresed. Then, the proteins were transferred onto a polyvinylidene fluoride microporous membrane for 90 min at 4°C and blocked with 5% skim milk in TBS-T (1 M Tris-HCl, 5 M NaCl, 10% Tween-20) for 1 h. The blot was incubated with rabbit anti-claudin-3, -occludin, and -ZO-1 or mouse anti-β-actin antibodies (Invitrogen, USA) overnight. Then, the membrane was washed and incubated with goat anti-rabbit or anti-mouse IgG-HRP antibody (Santa Cruz Biotechnology, USA) for 1 h. The target protein was visualized using an enhanced chemiluminescence system (GE Healthcare, USA), followed by analysis using a ChemiDoc XRS system (Bio-Rad, USA).
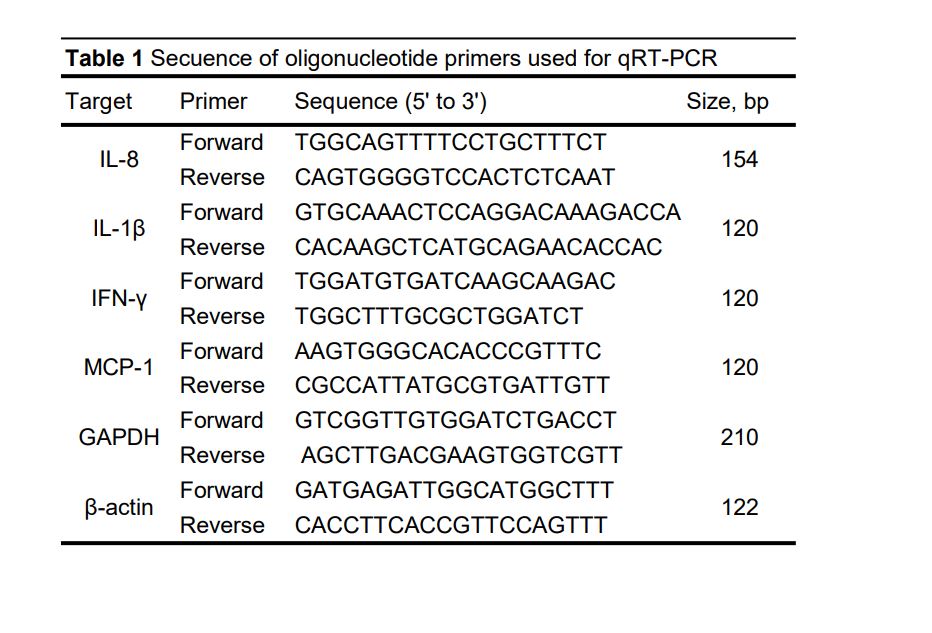
Real-time quantitative reverse transcription polymerase chain reaction (qRT-PCR)
Total RNA was isolated using TRIzol reagent according to the manufacturer’s instructions and reverse-transcribed to generate complementary DNA (cDNA) using oligo-dT primers (Bioneer, Korea). Real-time qRT-PCR was performed using a StepOne Plus real-time PCR system (Applied Biosystems, USA). The PCR reaction was conducted in a 96-well reaction plate using 9 μL SYBR green PCR Master Mix, 1 μL each of forward and reverse primers, 1 μL cDNA template, and 8 μL nuclease-free H2O. The PCR conditions included 40 thermal cycles of 2 min at 50°C, 10 min at 95°C, 15 s at 95°C, 30 s at 60°C, and 30 s at 72°C. Relative quantification of the target genes was calculated using the 2−ΔΔCt method. Target gene expression was normalized to glyceraldehyde 3-phosphate dehydrogenase (GAPDH) or β-actin mRNA level. Primer sequences used in this experiment are shown in Table 1.
Proportional changes of immune cells
We washed pPBMCs with PBS containing 1% FBS and performed staining using the following monoclonal antibodies at pre-determined optimal concentrations: mouse anti-porcine CD3e (clone PPT3; Southern Biotech, USA), CD4 FITC (clone 74-12-4; BD Biosciences), CD8a PE (clone 76-2-11; BD Biosciences), and CD172a biotin (clone 74-22-15; BD Biosciences). Rat anti-mouse IgG1 APC (clone A85-1, BD Biosciences) and streptavidin BV605 (Biolegend, USA) were used as the secondary antibody. The cells were incubated for 20 min at 4°C in the dark. After staining, the cells were washed and the expression of surface markers was measured using flow cytometry (FACSCanto II; BD Biosciences). All flow cytometric data were analyzed using the FlowJo software (Tree Star, USA).
Apoptosis analysis
Floating cells were collected and the attached cells were trypsinized for 5 min and washed with PBS. Finally, both trypsinized and floating cells were added together and stained with Annexin V-APC and propidium iodide (PI). Marker intensity was examined using flow cytometry (FACSCanto II; BD Biosciences). All flow cytometry data were analyzed using the FlowJo software (Tree Star).
Statistical analyses
Means ± standard deviation were determined on the basis of at least three different samples. All experiments were performed at least three times. Means were compared between two groups using two-tailed paired Student’s t-tests. The groups were compared by one-way analysis of variance (ANOVA), followed by the Friedman test and Tukey’s multiple comparison test. All statistical analyses were performed using GraphPad Prism software (v5.01; GraphPad Software, USA). Significance was evaluated at a level of P < 0.05.